Isochrones

from geosnap.analyze import isochrones_from_id, isochrones_from_gdf, pdna_to_adj 
from geosnap.io import get_acs
from geosnap import DataStore
/opt/tljh/user/lib/python3.10/site-packages/numba/core/decorators.py:262: NumbaDeprecationWarning: numba.generated_jit is deprecated. Please see the documentation at: https://numba.readthedocs.io/en/stable/reference/deprecation.html#deprecation-of-generated-jit for more information and advice on a suitable replacement.
  warnings.warn(msg, NumbaDeprecationWarning)
/opt/tljh/user/lib/python3.10/site-packages/quantecon/lss.py:20: NumbaDeprecationWarning: The 'nopython' keyword argument was not supplied to the 'numba.jit' decorator. The implicit default value for this argument is currently False, but it will be changed to True in Numba 0.59.0. See https://numba.readthedocs.io/en/stable/reference/deprecation.html#deprecation-of-object-mode-fall-back-behaviour-when-using-jit for details.
  def simulate_linear_model(A, x0, v, ts_length):
datasets = DataStore('/srv/data/geosnap')
sd_tracts = get_acs(datasets, county_fips='06073', years=[2018])
/opt/tljh/user/lib/python3.10/site-packages/geosnap/io/constructors.py:215: UserWarning: Currency columns unavailable at this resolution; not adjusting for inflation
  warn(
sd_tracts.plot()
<Axes: >

import pandana as pdna
import geopandas as gpd
import os
if not os.path.exists('41740.h5'):
    import quilt3 as q3
    b = q3.Bucket("s3://spatial-ucr")
    b.fetch("osm/metro_networks_8k/41740.h5", "./41740.h5")
sd_network = pdna.Network.from_hdf5("41740.h5")
Generating contraction hierarchies with 32 threads.
Setting CH node vector of size 332554
Setting CH edge vector of size 522484
Range graph removed 143094 edges of 1044968
. 10% . 20% . 30% . 40% . 50% . 60% . 70% . 80% . 90% . 100%
from random import sample
random_origin = sample(sd_network.nodes_df.index.unique().tolist(),1)[0]
random_origin
49555195
example_origin = 1985327805
adj = pdna_to_adj(sd_tracts.set_index('geoid'), sd_network, threshold=1600, )
/opt/tljh/user/lib/python3.10/site-packages/geosnap/analyze/network.py:34: UserWarning: Geometry is in a geographic CRS. Results from 'centroid' are likely incorrect. Use 'GeoSeries.to_crs()' to re-project geometries to a projected CRS before this operation.

  node_ids = network.get_node_ids(origins.centroid.x, origins.centroid.y).astype(int)
adj
origin destination cost
0 060730001001 060730001001 0.000000
136 060730001001 060730001002 987.565979
197 060730001001 060730002011 1221.943970
240 060730001001 060730002022 1465.890991
280 060730001002 060730001002 0.000000
... ... ... ...
1036301 060730166072 060730166071 1596.958008
1036304 060730166073 060730166073 0.000000
1036489 060730166073 060730166071 932.747009
1036512 060730166073 060730166072 982.960022
1036608 060730166073 060730166101 1229.456055

11391 rows × 3 columns

%%time
iso = isochrones_from_id(example_origin, sd_network, threshold=1600 ) # network is expressed in meters
/opt/tljh/user/lib/python3.10/site-packages/geosnap/analyze/network.py:34: UserWarning: Geometry is in a geographic CRS. Results from 'centroid' are likely incorrect. Use 'GeoSeries.to_crs()' to re-project geometries to a projected CRS before this operation.

  node_ids = network.get_node_ids(origins.centroid.x, origins.centroid.y).astype(int)
CPU times: user 1.87 s, sys: 13 ms, total: 1.89 s
Wall time: 1.7 s
iso.explore()
Make this Notebook Trusted to load map: File -> Trust Notebook
type(sd_network)
pandana.network.Network
dir(sd_network)
['__class__',
 '__delattr__',
 '__dict__',
 '__dir__',
 '__doc__',
 '__eq__',
 '__format__',
 '__ge__',
 '__getattribute__',
 '__gt__',
 '__hash__',
 '__init__',
 '__init_subclass__',
 '__le__',
 '__lt__',
 '__module__',
 '__ne__',
 '__new__',
 '__reduce__',
 '__reduce_ex__',
 '__repr__',
 '__setattr__',
 '__sizeof__',
 '__str__',
 '__subclasshook__',
 '__weakref__',
 '_imp_name_to_num',
 '_node_indexes',
 '_twoway',
 'aggregate',
 'aggregations',
 'bbox',
 'decays',
 'edges_df',
 'from_hdf5',
 'get_node_ids',
 'impedance_names',
 'init_pois',
 'kdtree',
 'low_connectivity_nodes',
 'nearest_pois',
 'net',
 'node_ids',
 'node_idx',
 'nodes_df',
 'nodes_in_range',
 'plot',
 'poi_category_indexes',
 'poi_category_names',
 'precompute',
 'save_hdf5',
 'set',
 'set_pois',
 'shortest_path',
 'shortest_path_length',
 'shortest_path_lengths',
 'shortest_paths',
 'variable_names']
from shapely.geometry import Point
pnt  = Point(sd_network.nodes_df.loc[example_origin])
gs = gpd.GeoSeries([pnt])
m = iso.explore()
gs.explore(color='r', m=m)
m
Make this Notebook Trusted to load map: File -> Trust Notebook
%%time
iso_multiple = isochrones_from_id(example_origin, sd_network, threshold=[1600, 2400, 3200]  )
/opt/tljh/user/lib/python3.10/site-packages/geosnap/analyze/network.py:34: UserWarning: Geometry is in a geographic CRS. Results from 'centroid' are likely incorrect. Use 'GeoSeries.to_crs()' to re-project geometries to a projected CRS before this operation.

  node_ids = network.get_node_ids(origins.centroid.x, origins.centroid.y).astype(int)
CPU times: user 994 ms, sys: 9.84 ms, total: 1 s
Wall time: 812 ms
iso_multiple.explore('distance', cmap='Blues_r', style_kwds={'fillOpacity':0.5})
Make this Notebook Trusted to load map: File -> Trust Notebook
gs = gpd.GeoSeries([pnt])
example_point = gpd.GeoDataFrame(geometry=gs)
example_point = example_point.set_crs(4326)
planar_iso = example_point.to_crs(example_point.estimate_utm_crs()).buffer(1600)
m = planar_iso.to_crs(4326).explore()
iso.explore(m=m)
Make this Notebook Trusted to load map: File -> Trust Notebook
nw_pnts = gpd.GeoDataFrame(geometry=[Point(*pnt) for pnt in sd_network.nodes_df.values])
nw_pnts.crs = iso.crs
local_pnts = iso.sindex.query(nw_pnts.geometry, predicate='within')[0]
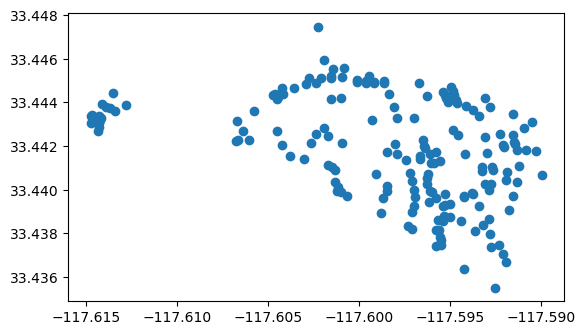
nw_pnts.loc[local_pnts].plot()
<Axes: >

m = iso.explore()
nw_pnts.loc[local_pnts].explore(m=m, color='r') # alpha shape
gs.explore(color='yellow', m=m)
Make this Notebook Trusted to load map: File -> Trust Notebook
from geosnap.io import get_nces
# same as county fips 06073 in this case, but use metro fips for consistency with network
sd = get_acs(datasets, msa_fips='41740', level='bg', years=[2019])
schools = get_nces(datasets, dataset='schools')
sd_schools = schools[schools.to_crs(sd.crs).intersects(sd.unary_union)]
sd_schools.head()
NCESSCH NAME OPSTFIPS LSTREE LCITY LSTATE LZIP LZIP4 STFIP15 CNTY15 ... CBSATYPE15 CSA15 NMCSA15 NECTA15 NMNECTA15 CD15 SLDL15 SLDU15 geometry year
5895 060004205341 Warner Junior/Senior High 06 30951 Highway 79 Warner Springs CA 92086 M 06 06073 ... 1 N N N N 0650 071 038 POINT (-116.64292 33.27525) 1516
5896 060004206527 San Jose Valley Continuation Hig 06 30951 Highway 79 Warner Springs CA 92086 M 06 06073 ... 1 N N N N 0650 071 038 POINT (-116.64292 33.27525) 1516
5897 060004206844 Warner Elementary 06 30951 Highway 79 Warner Springs CA 92086 0008 06 06073 ... 1 N N N N 0650 071 038 POINT (-116.64292 33.27525) 1516
5898 060004210387 All Tribes Charter 06 34320 Valley Center Rd. Valley Center CA 92082 6046 06 06073 ... 1 N N N N 0650 075 038 POINT (-116.95367 33.27796) 1516
5899 060004212735 All Tribes Elementary Charter 06 34320 Valley Center Rd. Valley Center CA 92082 6046 06 06073 ... 1 N N N N 0650 075 038 POINT (-116.95367 33.27796) 1516

5 rows × 26 columns

sd_schools.shape
(767, 26)
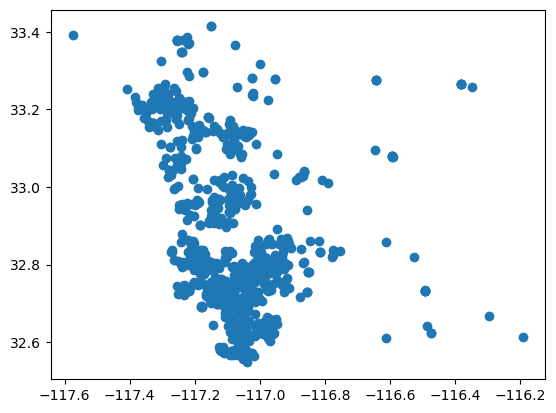
sd_schools.plot()
<Axes: >

# randomly sample 25 schools and compute their walksheds

school_neighborhoods = isochrones_from_gdf(origins=sd_schools.sample(25), network=sd_network, threshold=1600,)
/opt/tljh/user/lib/python3.10/site-packages/geosnap/analyze/network.py:140: UserWarning: Geometry is in a geographic CRS. Results from 'centroid' are likely incorrect. Use 'GeoSeries.to_crs()' to re-project geometries to a projected CRS before this operation.

  node_ids = network.get_node_ids(origins.centroid.x, origins.centroid.y).astype(int)
/opt/tljh/user/lib/python3.10/site-packages/geosnap/analyze/network.py:34: UserWarning: Geometry is in a geographic CRS. Results from 'centroid' are likely incorrect. Use 'GeoSeries.to_crs()' to re-project geometries to a projected CRS before this operation.

  node_ids = network.get_node_ids(origins.centroid.x, origins.centroid.y).astype(int)
school_neighborhoods.explore()
Make this Notebook Trusted to load map: File -> Trust Notebook

For all schools it will take a while (Stop here and move to spatial_joins nb)

school_neighborhoods = isochrones_from_gdf(origins=sd_schools, network=sd_network, threshold=1600,)
/opt/tljh/user/lib/python3.10/site-packages/geosnap/analyze/network.py:140: UserWarning: Geometry is in a geographic CRS. Results from 'centroid' are likely incorrect. Use 'GeoSeries.to_crs()' to re-project geometries to a projected CRS before this operation.

  node_ids = network.get_node_ids(origins.centroid.x, origins.centroid.y).astype(int)
/opt/tljh/user/lib/python3.10/site-packages/geosnap/analyze/network.py:34: UserWarning: Geometry is in a geographic CRS. Results from 'centroid' are likely incorrect. Use 'GeoSeries.to_crs()' to re-project geometries to a projected CRS before this operation.

  node_ids = network.get_node_ids(origins.centroid.x, origins.centroid.y).astype(int)
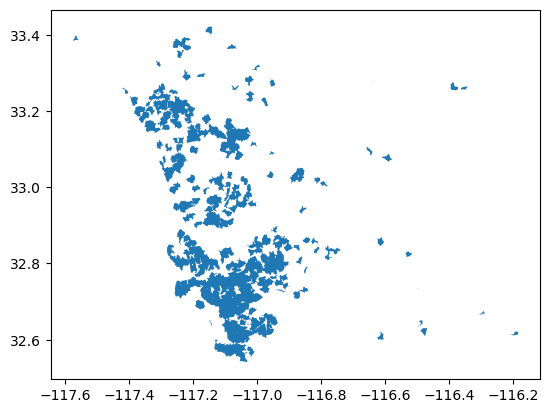
school_neighborhoods.plot()
<Axes: >

sh_union = school_neighborhoods.unary_union
sh_union

school_neighborhoods.head()
geometry distance
origin
5900 POLYGON ((-116.64411 33.27421, -116.64491 33.2... 1600
5899 POLYGON ((-116.95443 33.28123, -116.95096 33.2... 1600
6045 POLYGON ((-117.02136 33.27643, -117.02352 33.2... 1600
6046 POLYGON ((-117.02136 33.27643, -117.02352 33.2... 1600
6047 POLYGON ((-116.99063 33.31583, -117.00177 33.3... 1600
s20 = school_neighborhoods.dissolve(by='distance')
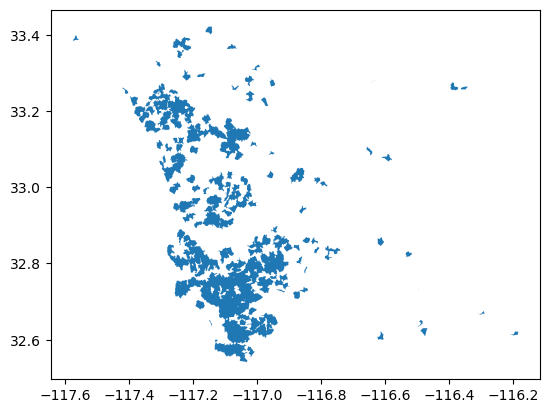
s20.plot()
<Axes: >

import tobler
res = tobler.area_weighted.area_interpolate(sd_tracts, s20, extensive_variables=['n_total_pop', 'n_hispanic_persons'])
Source and target dataframes have different crs. Please correct.
sd_tracts.crs, s20.crs
(<Geographic 2D CRS: EPSG:4269>
 Name: NAD83
 Axis Info [ellipsoidal]:
 - Lat[north]: Geodetic latitude (degree)
 - Lon[east]: Geodetic longitude (degree)
 Area of Use:
 - name: North America - onshore and offshore: Canada - Alberta; British Columbia; Manitoba; New Brunswick; Newfoundland and Labrador; Northwest Territories; Nova Scotia; Nunavut; Ontario; Prince Edward Island; Quebec; Saskatchewan; Yukon. Puerto Rico. United States (USA) - Alabama; Alaska; Arizona; Arkansas; California; Colorado; Connecticut; Delaware; Florida; Georgia; Hawaii; Idaho; Illinois; Indiana; Iowa; Kansas; Kentucky; Louisiana; Maine; Maryland; Massachusetts; Michigan; Minnesota; Mississippi; Missouri; Montana; Nebraska; Nevada; New Hampshire; New Jersey; New Mexico; New York; North Carolina; North Dakota; Ohio; Oklahoma; Oregon; Pennsylvania; Rhode Island; South Carolina; South Dakota; Tennessee; Texas; Utah; Vermont; Virginia; Washington; West Virginia; Wisconsin; Wyoming. US Virgin Islands.  British Virgin Islands.
 - bounds: (167.65, 14.92, -47.74, 86.46)
 Datum: North American Datum 1983
 - Ellipsoid: GRS 1980
 - Prime Meridian: Greenwich,
 <Geographic 2D CRS: EPSG:4326>
 Name: WGS 84
 Axis Info [ellipsoidal]:
 - Lat[north]: Geodetic latitude (degree)
 - Lon[east]: Geodetic longitude (degree)
 Area of Use:
 - name: World.
 - bounds: (-180.0, -90.0, 180.0, 90.0)
 Datum: World Geodetic System 1984 ensemble
 - Ellipsoid: WGS 84
 - Prime Meridian: Greenwich)
sd_tracts = sd_tracts.to_crs(sd_tracts.estimate_utm_crs())
s20 = s20.to_crs(sd_tracts.crs)
res = tobler.area_weighted.area_interpolate(sd_tracts, s20, extensive_variables=['n_total_pop', 'n_hispanic_persons'])
res.head()
n_total_pop n_hispanic_persons geometry
distance
1600 3.223012e+06 1.091683e+06 MULTIPOLYGON (((474153.207 3631273.494, 474179...
res1 = tobler.area_weighted.area_interpolate(sd_tracts, s20, extensive_variables=['n_total_pop', 'n_hispanic_persons'],
                                           allocate_total=False)
res1.head()
n_total_pop n_hispanic_persons geometry
distance
1600 2.220035e+06 845495.649364 MULTIPOLYGON (((474153.207 3631273.494, 474179...
res1.n_hispanic_persons / res1.n_total_pop
distance
1600    0.380848
dtype: float64
res.n_hispanic_persons / res.n_total_pop
distance
1600    0.338715
dtype: float64
outh = res.n_hispanic_persons - res1.n_hispanic_persons
outd = res.n_total_pop - res1.n_total_pop
outh/outd
distance
1600    0.245457
dtype: float64
res1.n_hispanic_persons / res.n_hispanic_persons
distance
1600    0.774488
Name: n_hispanic_persons, dtype: float64
wt = res.n_total_pop - res.n_hispanic_persons
wo = res1.n_total_pop - res1.n_hispanic_persons
wo/wt
distance
1600    0.644921
dtype: float64