Introduction to Area Unit Data

Spring 2023

Author

Serge Rey

Published

February 21, 2023

Areal Unit Data

import geopandas
import libpysal
/tmp/ipykernel_325329/1387931905.py:1: UserWarning:

Shapely 2.0 is installed, but because PyGEOS is also installed, GeoPandas will still use PyGEOS by default for now. To force to use and test Shapely 2.0, you have to set the environment variable USE_PYGEOS=0. You can do this before starting the Python process, or in your code before importing geopandas:

import os
os.environ['USE_PYGEOS'] = '0'
import geopandas

In a future release, GeoPandas will switch to using Shapely by default. If you are using PyGEOS directly (calling PyGEOS functions on geometries from GeoPandas), this will then stop working and you are encouraged to migrate from PyGEOS to Shapely 2.0 (https://shapely.readthedocs.io/en/latest/migration_pygeos.html).
south = libpysal.examples.load_example('South')
libpysal.examples.explain('South')
south_gdf = geopandas.read_file(south.get_path('south.shp'))
south_gdf.plot()
<Axes: >

Geometry of the Data Set

south_gdf.crs
<Geographic 2D CRS: EPSG:4326>
Name: WGS 84
Axis Info [ellipsoidal]:
- Lat[north]: Geodetic latitude (degree)
- Lon[east]: Geodetic longitude (degree)
Area of Use:
- name: World.
- bounds: (-180.0, -90.0, 180.0, 90.0)
Datum: World Geodetic System 1984 ensemble
- Ellipsoid: WGS 84
- Prime Meridian: Greenwich
ax = south_gdf.plot()
ax.set_axis_off();

south_gdf.shape
(1412, 70)
south_gdf.geometry
0       POLYGON ((-80.62805 40.39816, -80.60204 40.480...
1       POLYGON ((-80.52625 40.16245, -80.58760 40.175...
2       POLYGON ((-80.52517 40.02275, -80.73843 40.035...
3       POLYGON ((-80.52447 39.72113, -80.83248 39.718...
4       POLYGON ((-75.77270 39.38301, -75.79144 39.723...
                              ...                        
1407    POLYGON ((-79.14433 36.54606, -79.21706 36.549...
1408    POLYGON ((-79.43775 37.61596, -79.45834 37.603...
1409    POLYGON ((-80.12475 37.12510, -80.14045 37.128...
1410    POLYGON ((-76.39569 37.10771, -76.40270 37.090...
1411    POLYGON ((-77.53178 38.56506, -77.72094 38.840...
Name: geometry, Length: 1412, dtype: geometry
south_gdf.geometry.values[0]

geom0 = south_gdf.geometry.values[0]
dir(geom0)
['__and__',
 '__bool__',
 '__class__',
 '__delattr__',
 '__dir__',
 '__doc__',
 '__eq__',
 '__format__',
 '__ge__',
 '__geo_interface__',
 '__getattribute__',
 '__gt__',
 '__hash__',
 '__init__',
 '__init_subclass__',
 '__le__',
 '__lt__',
 '__module__',
 '__ne__',
 '__new__',
 '__nonzero__',
 '__or__',
 '__reduce__',
 '__reduce_ex__',
 '__repr__',
 '__setattr__',
 '__setstate__',
 '__sizeof__',
 '__slots__',
 '__str__',
 '__sub__',
 '__subclasshook__',
 '__xor__',
 '_geom',
 '_geom_prepared',
 '_ndim',
 '_repr_svg_',
 'almost_equals',
 'area',
 'boundary',
 'bounds',
 'buffer',
 'centroid',
 'contains',
 'contains_properly',
 'convex_hull',
 'coords',
 'covered_by',
 'covers',
 'crosses',
 'difference',
 'disjoint',
 'distance',
 'dwithin',
 'envelope',
 'equals',
 'equals_exact',
 'exterior',
 'from_bounds',
 'geom_type',
 'geometryType',
 'has_z',
 'hausdorff_distance',
 'interiors',
 'interpolate',
 'intersection',
 'intersects',
 'is_closed',
 'is_empty',
 'is_ring',
 'is_simple',
 'is_valid',
 'length',
 'line_interpolate_point',
 'line_locate_point',
 'minimum_clearance',
 'minimum_rotated_rectangle',
 'normalize',
 'oriented_envelope',
 'overlaps',
 'point_on_surface',
 'project',
 'relate',
 'relate_pattern',
 'representative_point',
 'reverse',
 'segmentize',
 'simplify',
 'svg',
 'symmetric_difference',
 'touches',
 'type',
 'union',
 'within',
 'wkb',
 'wkb_hex',
 'wkt',
 'xy']
geom0.bounds
(-80.6688232421875, 40.39815902709961, -80.52220916748047, 40.63713836669922)
geom0.exterior.coords.xy
(array('d', [-80.6280517578125, -80.60203552246094, -80.62545776367188, -80.6336441040039, -80.6688232421875, -80.66793060302734, -80.63754272460938, -80.61175537109375, -80.57462310791016, -80.52220916748047, -80.52456665039062, -80.52377319335938, -80.6280517578125]),
 array('d', [40.39815902709961, 40.480472564697266, 40.504398345947266, 40.53913879394531, 40.568214416503906, 40.58207321166992, 40.61391830444336, 40.619998931884766, 40.615909576416016, 40.63713836669922, 40.47871780395508, 40.4029655456543, 40.39815902709961]))
geom0.wkt
'POLYGON ((-80.6280517578125 40.39815902709961, -80.60203552246094 40.480472564697266, -80.62545776367188 40.504398345947266, -80.6336441040039 40.53913879394531, -80.6688232421875 40.568214416503906, -80.66793060302734 40.58207321166992, -80.63754272460938 40.61391830444336, -80.61175537109375 40.619998931884766, -80.57462310791016 40.615909576416016, -80.52220916748047 40.63713836669922, -80.52456665039062 40.47871780395508, -80.52377319335938 40.4029655456543, -80.6280517578125 40.39815902709961))'
rp0 = geom0.representative_point()
rp0

rp0.xy
(array('d', [-80.57673846928705]), array('d', [40.52176856994629]))
geom0.contains(rp0)
True
rp0.within(geom0)
True

Attributes

south_gdf.columns
Index(['NAME', 'STATE_NAME', 'STATE_FIPS', 'CNTY_FIPS', 'FIPS', 'STFIPS',
       'COFIPS', 'FIPSNO', 'SOUTH', 'HR60', 'HR70', 'HR80', 'HR90', 'HC60',
       'HC70', 'HC80', 'HC90', 'PO60', 'PO70', 'PO80', 'PO90', 'RD60', 'RD70',
       'RD80', 'RD90', 'PS60', 'PS70', 'PS80', 'PS90', 'UE60', 'UE70', 'UE80',
       'UE90', 'DV60', 'DV70', 'DV80', 'DV90', 'MA60', 'MA70', 'MA80', 'MA90',
       'POL60', 'POL70', 'POL80', 'POL90', 'DNL60', 'DNL70', 'DNL80', 'DNL90',
       'MFIL59', 'MFIL69', 'MFIL79', 'MFIL89', 'FP59', 'FP69', 'FP79', 'FP89',
       'BLK60', 'BLK70', 'BLK80', 'BLK90', 'GI59', 'GI69', 'GI79', 'GI89',
       'FH60', 'FH70', 'FH80', 'FH90', 'geometry'],
      dtype='object')
south_gdf.explore(column='HR60')
Make this Notebook Trusted to load map: File -> Trust Notebook
south_gdf.explore(column='HR60', tooltip=['HR60', 'STATE_NAME', 'NAME', 'HR90'])
Make this Notebook Trusted to load map: File -> Trust Notebook
south_gdf.HR60.describe()
count    1412.000000
mean        7.292144
std         6.421018
min         0.000000
25%         3.213471
50%         6.245125
75%         9.956272
max        92.936803
Name: HR60, dtype: float64
ax = south_gdf.plot(column='HR60')
ax.set_axis_off();

How many states are there in this dataset

south_gdf.STATE_NAME.unique().shape
(17,)

How many counties?

south_gdf.shape[0]
1412

How many counties in each state?

south_gdf[['STATE_NAME', 'FIPS']].groupby(by='STATE_NAME').count()
FIPS
STATE_NAME
Alabama 67
Arkansas 75
Delaware 3
District of Columbia 1
Florida 67
Georgia 159
Kentucky 120
Louisiana 64
Maryland 24
Mississippi 82
North Carolina 100
Oklahoma 77
South Carolina 46
Tennessee 95
Texas 254
Virginia 123
West Virginia 55

Which state had the highest median county homicide rate in 1960?

south_gdf[['STATE_NAME', 'HR60']].groupby(by='STATE_NAME').median()
HR60
STATE_NAME
Alabama 9.623977
Arkansas 4.704111
Delaware 4.228385
District of Columbia 10.471807
Florida 9.970306
Georgia 9.300076
Kentucky 5.235436
Louisiana 6.840286
Maryland 5.335208
Mississippi 8.919274
North Carolina 7.633043
Oklahoma 4.269126
South Carolina 7.509437
Tennessee 4.877751
Texas 4.326215
Virginia 6.672004
West Virginia 2.623226

Which county had the highest maximum county homicide rate in 1960?

south_gdf[['STATE_NAME', 'HR60']].groupby(by='STATE_NAME').max()
HR60
STATE_NAME
Alabama 24.903499
Arkansas 21.154427
Delaware 7.286472
District of Columbia 10.471807
Florida 40.744262
Georgia 53.304904
Kentucky 37.250885
Louisiana 18.243736
Maryland 14.327234
Mississippi 24.833923
North Carolina 25.660127
Oklahoma 17.088175
South Carolina 23.345940
Tennessee 20.894275
Texas 92.936803
Virginia 23.575639
West Virginia 11.482375

Intra-state dispersion

south_gdf[['STATE_NAME', 'HR60']].groupby(by='STATE_NAME').std()
HR60
STATE_NAME
Alabama 4.742337
Arkansas 4.574625
Delaware 1.815562
District of Columbia NaN
Florida 7.990692
Georgia 7.906488
Kentucky 6.354316
Louisiana 4.189146
Maryland 4.064360
Mississippi 4.972698
North Carolina 4.596952
Oklahoma 4.231132
South Carolina 4.018644
Tennessee 4.354979
Texas 8.223844
Virginia 4.826707
West Virginia 2.773659
sgdf = south_gdf[['STATE_NAME', 'HR60']].groupby(by='STATE_NAME').std()
cv = sgdf / south_gdf[['STATE_NAME', 'HR60']].groupby(by='STATE_NAME').mean() * 100
cv.sort_values(by='HR60', ascending=False)
HR60
STATE_NAME
Texas 144.992919
Kentucky 96.815524
West Virginia 93.234007
Arkansas 81.223752
Oklahoma 81.114430
Tennessee 75.426226
Georgia 73.774440
Maryland 71.898559
Florida 68.252692
Virginia 66.924041
Louisiana 59.994571
Mississippi 57.457024
North Carolina 57.013871
Alabama 49.070812
South Carolina 48.083524
Delaware 34.966796
District of Columbia NaN

Centroids and Projections

cents = south_gdf.geometry.centroid
/tmp/ipykernel_325329/735428549.py:1: UserWarning:

Geometry is in a geographic CRS. Results from 'centroid' are likely incorrect. Use 'GeoSeries.to_crs()' to re-project geometries to a projected CRS before this operation.

south_gdf.estimate_utm_crs()
<Projected CRS: EPSG:32615>
Name: WGS 84 / UTM zone 15N
Axis Info [cartesian]:
- E[east]: Easting (metre)
- N[north]: Northing (metre)
Area of Use:
- name: Between 96°W and 90°W, northern hemisphere between equator and 84°N, onshore and offshore. Canada - Manitoba; Nunavut; Ontario. Ecuador -Galapagos. Guatemala. Mexico. United States (USA).
- bounds: (-96.0, 0.0, -90.0, 84.0)
Coordinate Operation:
- name: UTM zone 15N
- method: Transverse Mercator
Datum: World Geodetic System 1984 ensemble
- Ellipsoid: WGS 84
- Prime Meridian: Greenwich
geometry_utm = south_gdf.geometry.to_crs(south_gdf.estimate_utm_crs())
geometry_utm
0       POLYGON ((1551180.383 4546131.160, 1552088.484...
1       POLYGON ((1563606.155 4521109.514, 1558163.321...
2       POLYGON ((1565916.726 4505557.619, 1547448.547...
3       POLYGON ((1570744.723 4471954.424, 1544275.138...
4       POLYGON ((1987822.322 4503609.764, 1978677.613...
                              ...                        
1407    POLYGON ((1743591.835 4135077.022, 1736966.984...
1408    POLYGON ((1699722.097 4250803.339, 1698098.723...
1409    POLYGON ((1646297.679 4187243.370, 1644842.996...
1410    POLYGON ((1980788.647 4238384.975, 1980504.623...
1411    POLYGON ((1851127.891 4383780.417, 1829264.981...
Name: geometry, Length: 1412, dtype: geometry
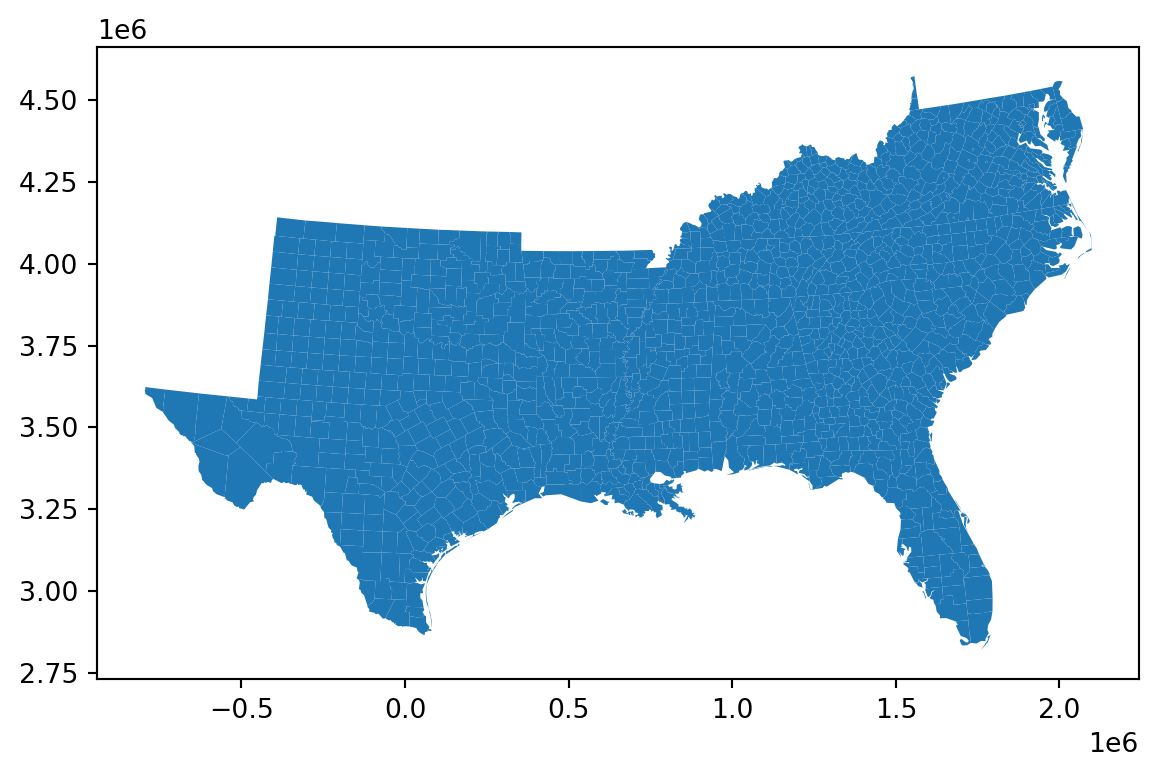
geometry_utm.plot()
<Axes: >

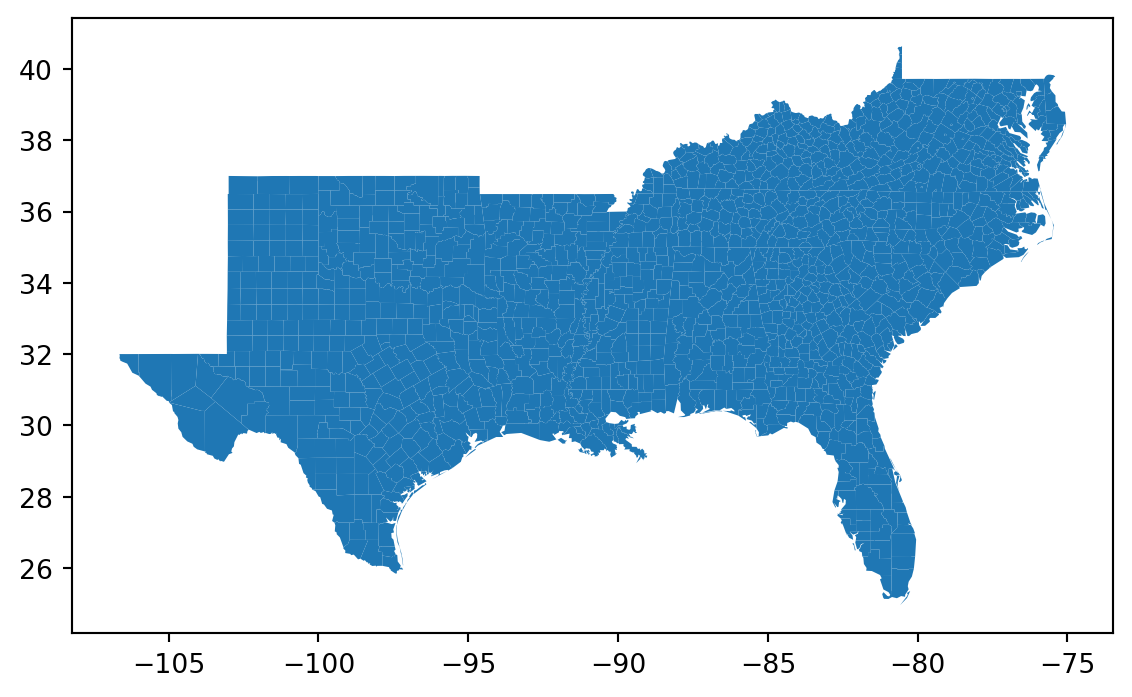
south_gdf.plot()
<Axes: >

south_gdf['geometry_utm'] = geometry_utm
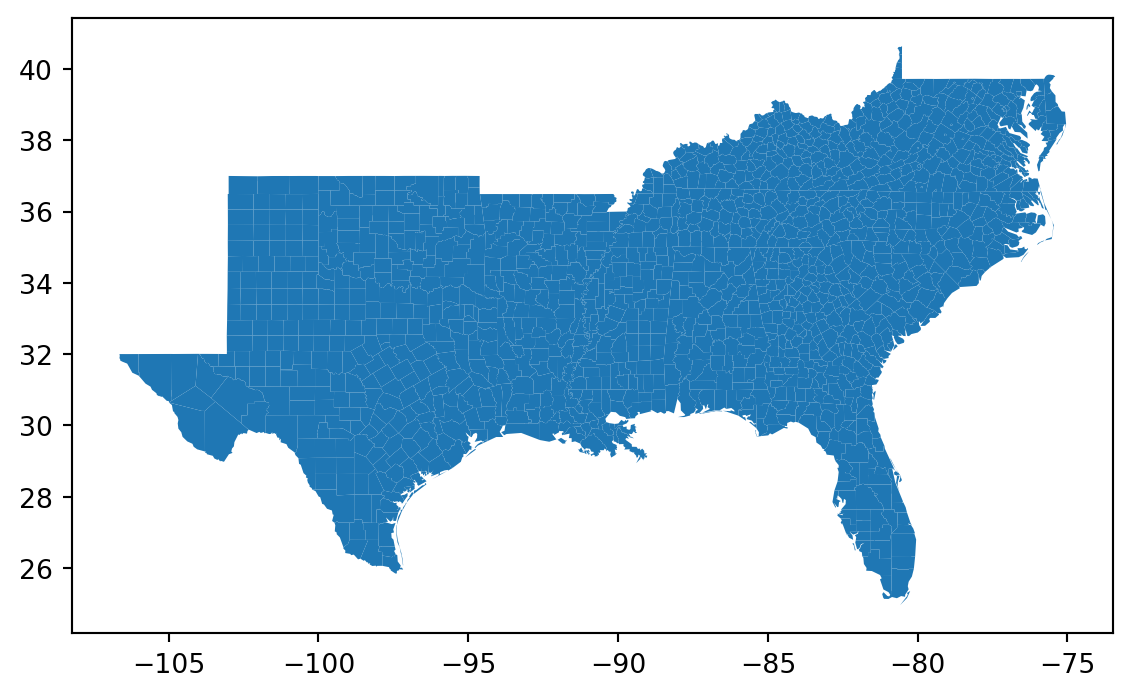
south_gdf.plot()
<Axes: >

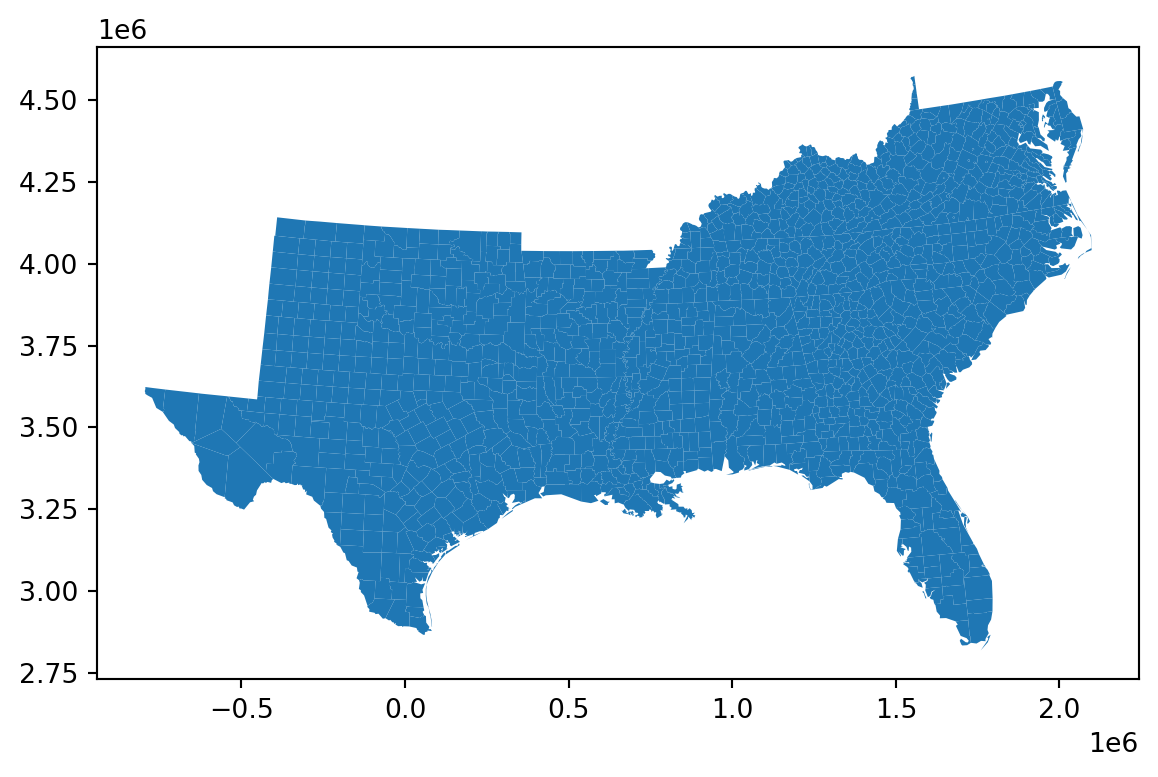
south_gdf.set_geometry('geometry_utm', inplace=True)
south_gdf.plot()
<Axes: >

south_gdf.crs
<Projected CRS: EPSG:32615>
Name: WGS 84 / UTM zone 15N
Axis Info [cartesian]:
- E[east]: Easting (metre)
- N[north]: Northing (metre)
Area of Use:
- name: Between 96°W and 90°W, northern hemisphere between equator and 84°N, onshore and offshore. Canada - Manitoba; Nunavut; Ontario. Ecuador -Galapagos. Guatemala. Mexico. United States (USA).
- bounds: (-96.0, 0.0, -90.0, 84.0)
Coordinate Operation:
- name: UTM zone 15N
- method: Transverse Mercator
Datum: World Geodetic System 1984 ensemble
- Ellipsoid: WGS 84
- Prime Meridian: Greenwich
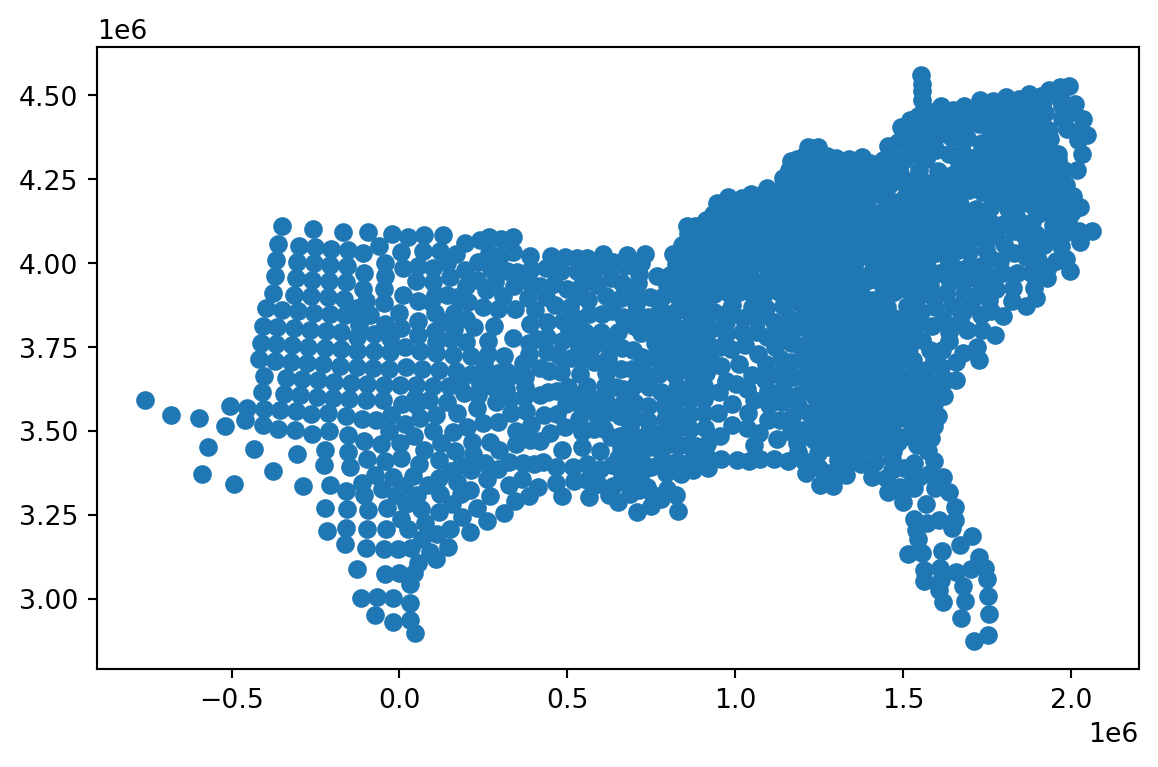
cents = south_gdf.geometry.centroid
cents.plot()
<Axes: >

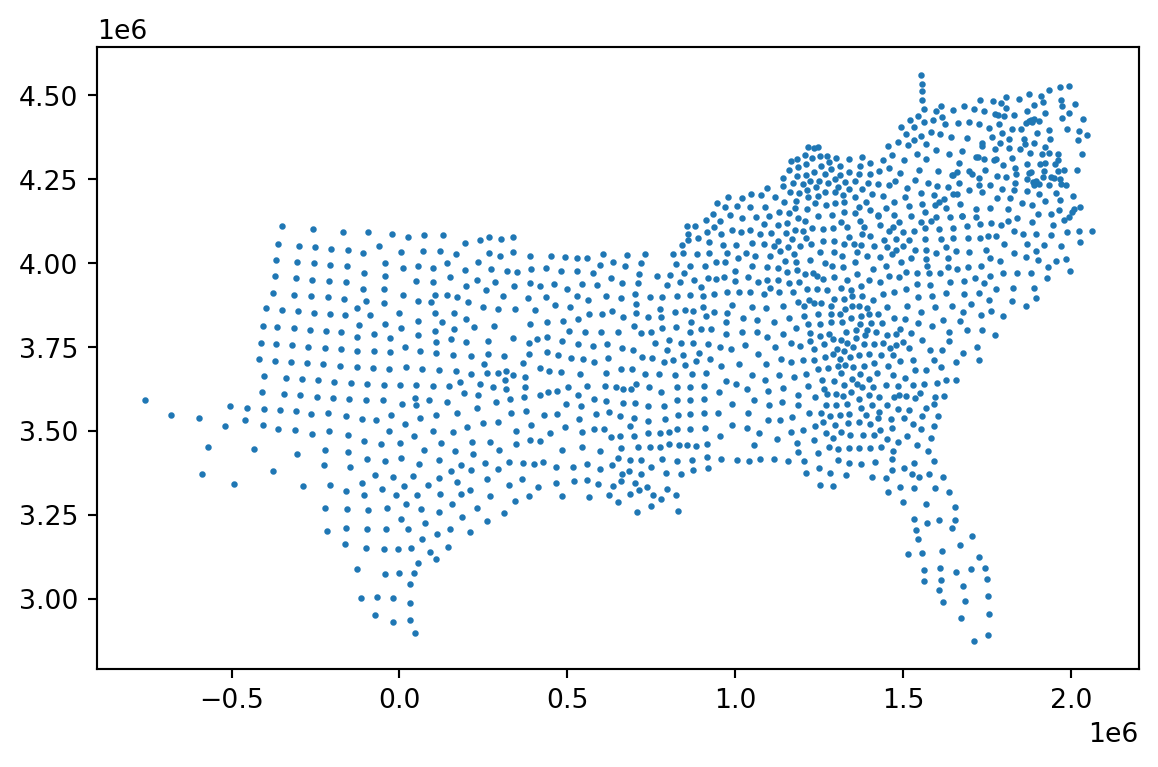
cents.plot(markersize=2)
<Axes: >

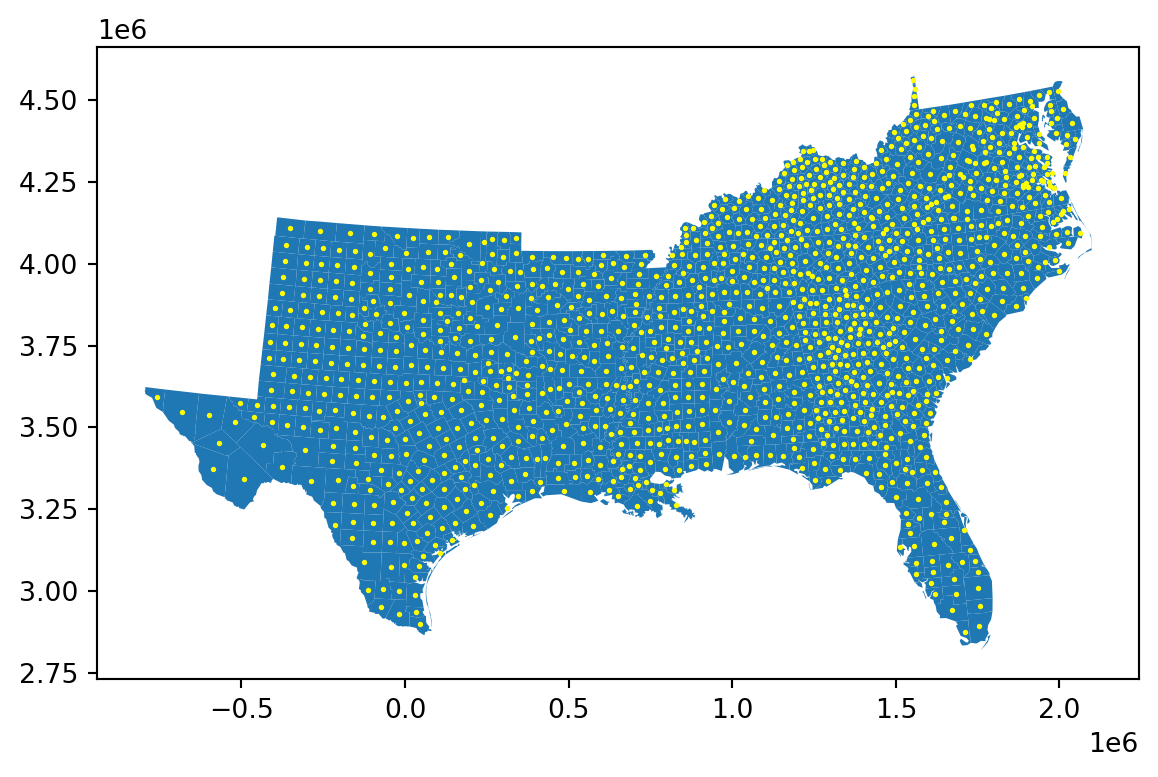
base = south_gdf.plot()
cents.plot(ax=base, color='yellow', markersize=1)
<Axes: >

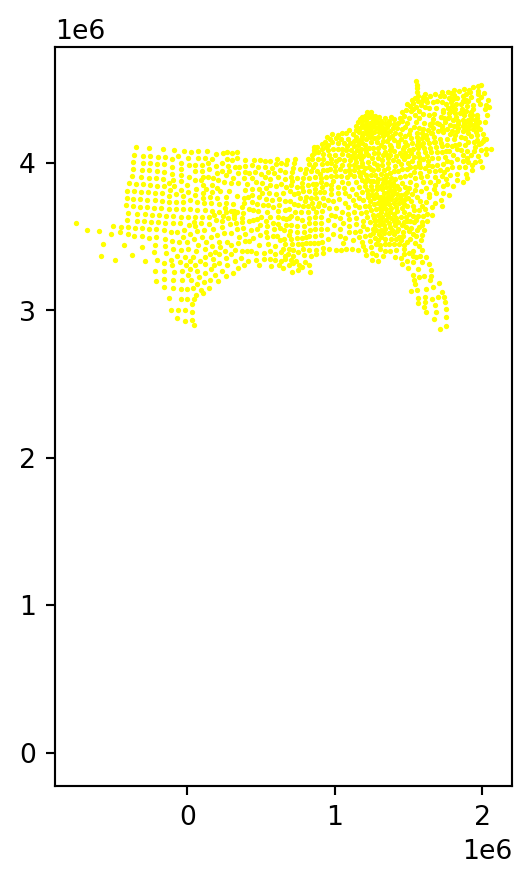
south_gdf.set_geometry('geometry', inplace=True)
base = south_gdf.plot()
cents.plot(ax=base, color='yellow', markersize=1)
<Axes: >

south_gdf.crs
<Geographic 2D CRS: EPSG:4326>
Name: WGS 84
Axis Info [ellipsoidal]:
- Lat[north]: Geodetic latitude (degree)
- Lon[east]: Geodetic longitude (degree)
Area of Use:
- name: World.
- bounds: (-180.0, -90.0, 180.0, 90.0)
Datum: World Geodetic System 1984 ensemble
- Ellipsoid: WGS 84
- Prime Meridian: Greenwich
cents.crs
<Projected CRS: EPSG:32615>
Name: WGS 84 / UTM zone 15N
Axis Info [cartesian]:
- E[east]: Easting (metre)
- N[north]: Northing (metre)
Area of Use:
- name: Between 96°W and 90°W, northern hemisphere between equator and 84°N, onshore and offshore. Canada - Manitoba; Nunavut; Ontario. Ecuador -Galapagos. Guatemala. Mexico. United States (USA).
- bounds: (-96.0, 0.0, -90.0, 84.0)
Coordinate Operation:
- name: UTM zone 15N
- method: Transverse Mercator
Datum: World Geodetic System 1984 ensemble
- Ellipsoid: WGS 84
- Prime Meridian: Greenwich