Geographic Information Systems for Public Policy - Lecture X
Vector Analysis: Buffering
Sergio Rey
Last Time
- Detecting Geometry Problems
- Understanding Geometry Problems
- Fixing Geometry Problems
Today
- Deterministic Spatial Analysis
- Buffers and Buffering
- Select by Location
- Health Deserts
Deterministic Spatial Analysis
Dimensions of vector geometries
- Point: 0-dimension
- Line: 1-dimensional (length)
- Polygon: 2-dimensional (area)
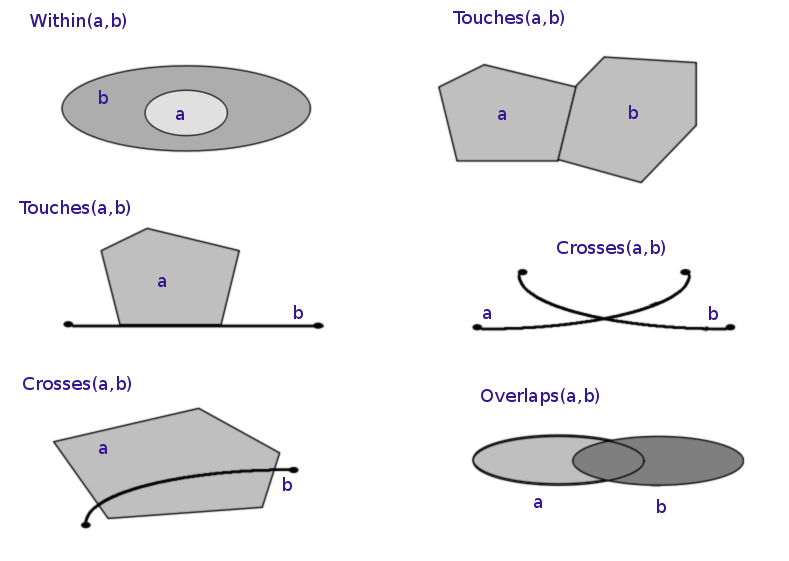
Spatial Relations
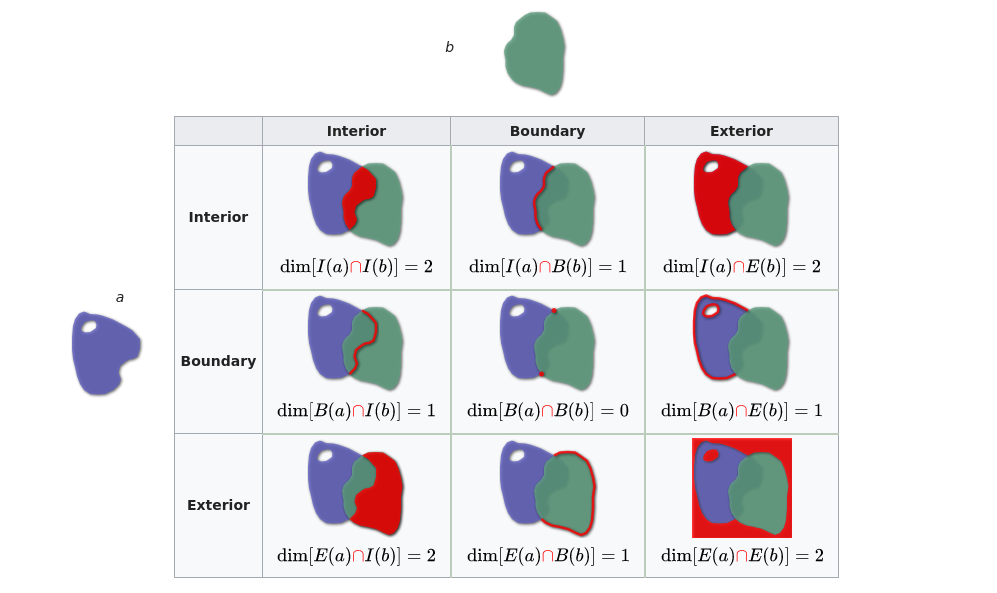
Dimensionally Extended nine-Intersection Mode (DE-9IM)
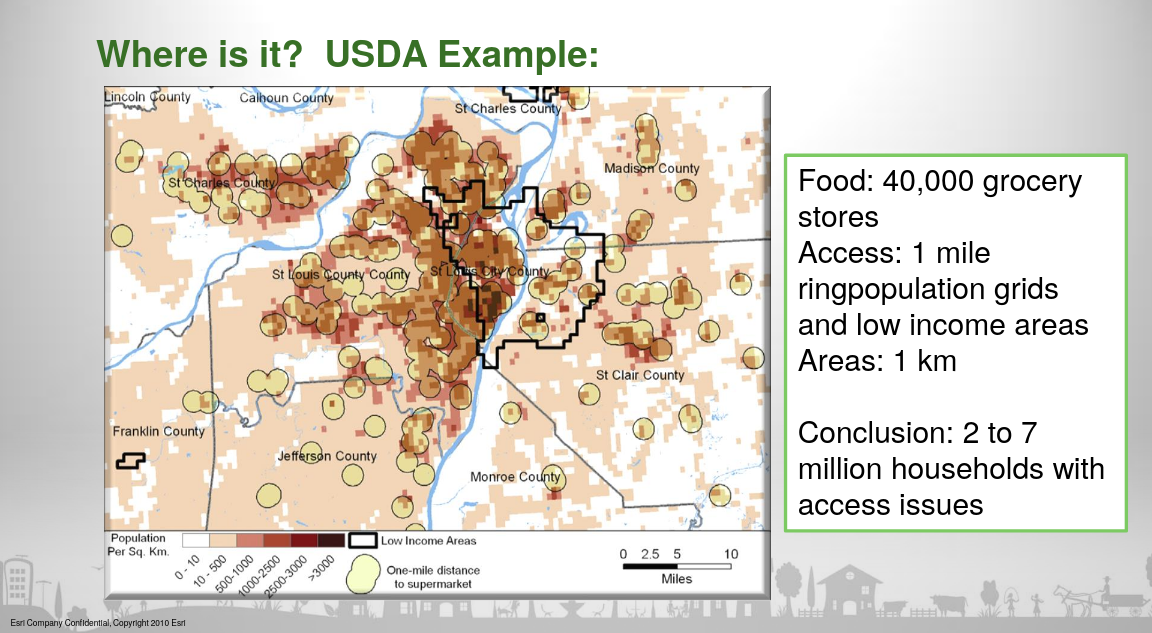
Food Deserts url
Today: Clinic Deserts
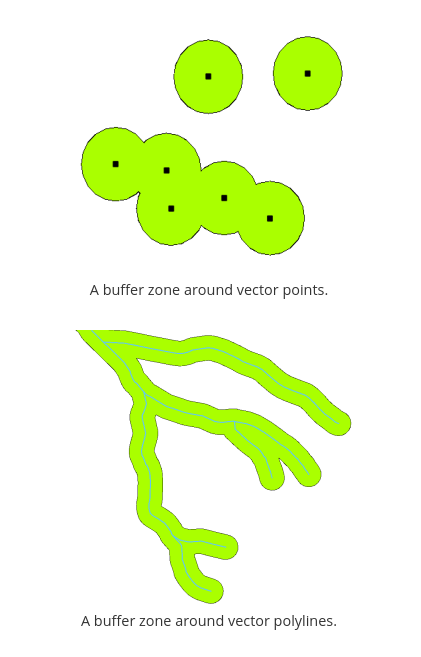
Buffers and Buffering
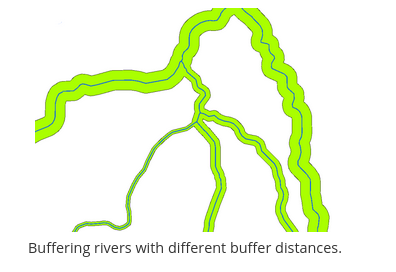
Buffers
Buffers (Variable)
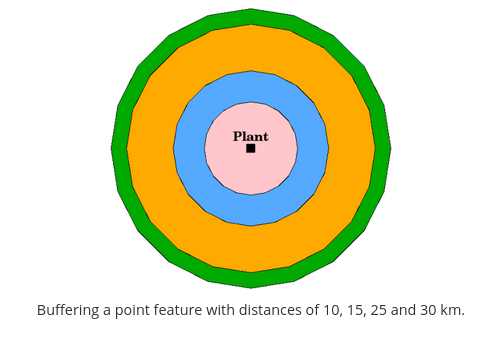
Buffers (Rings)
Buffers (Dissolve)

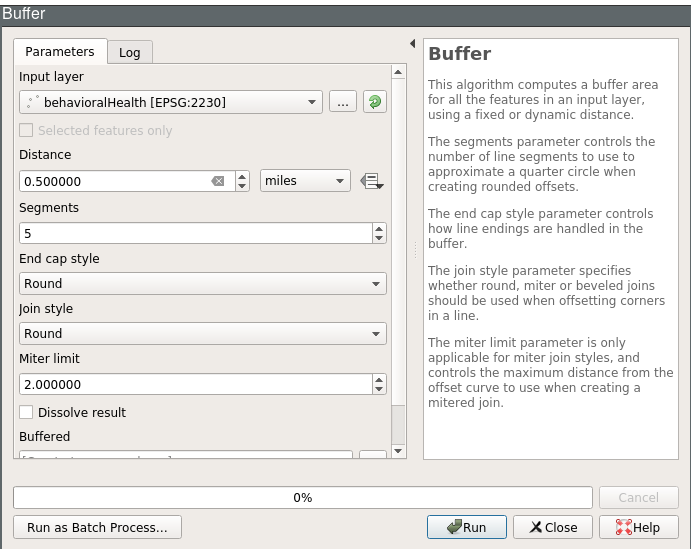
Buffering the Clinics
- food deserts: 0.5 mile distance
- use for the clinic points
- will revisit other distances later
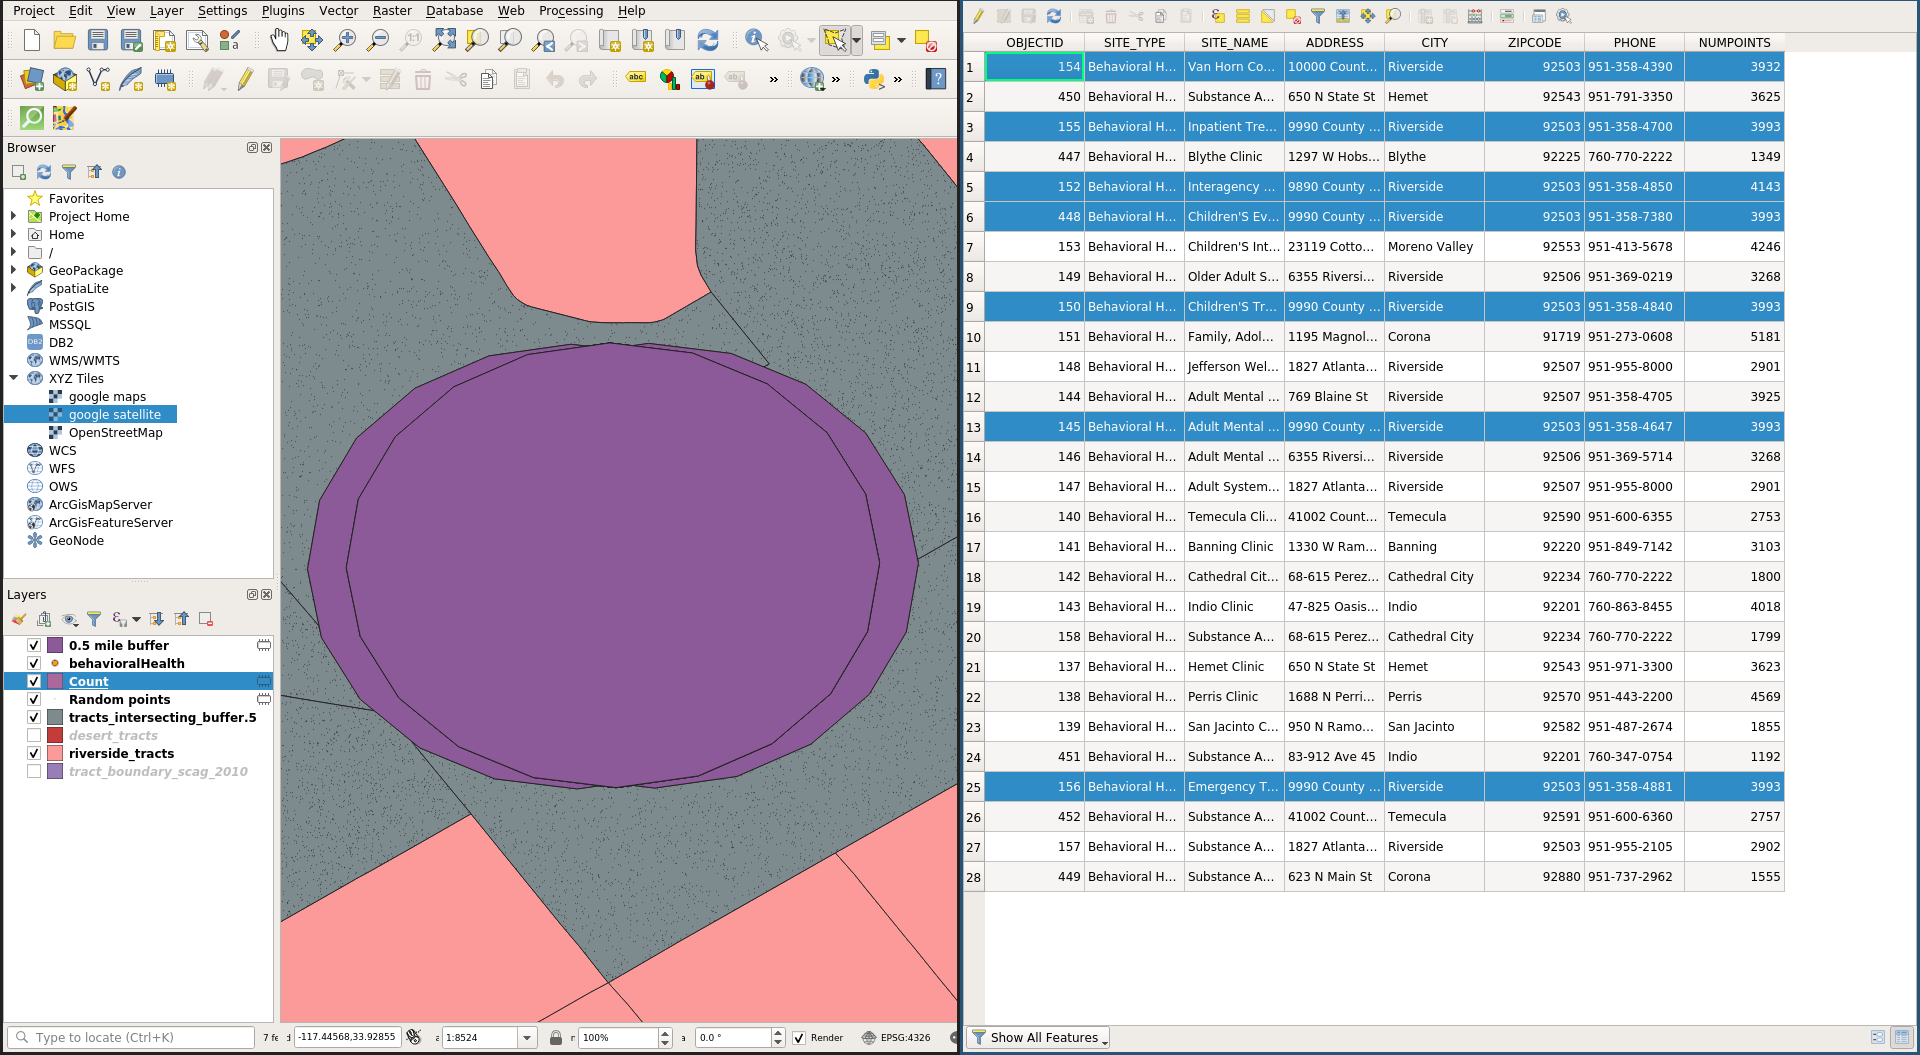
.5 mile clinic buffer
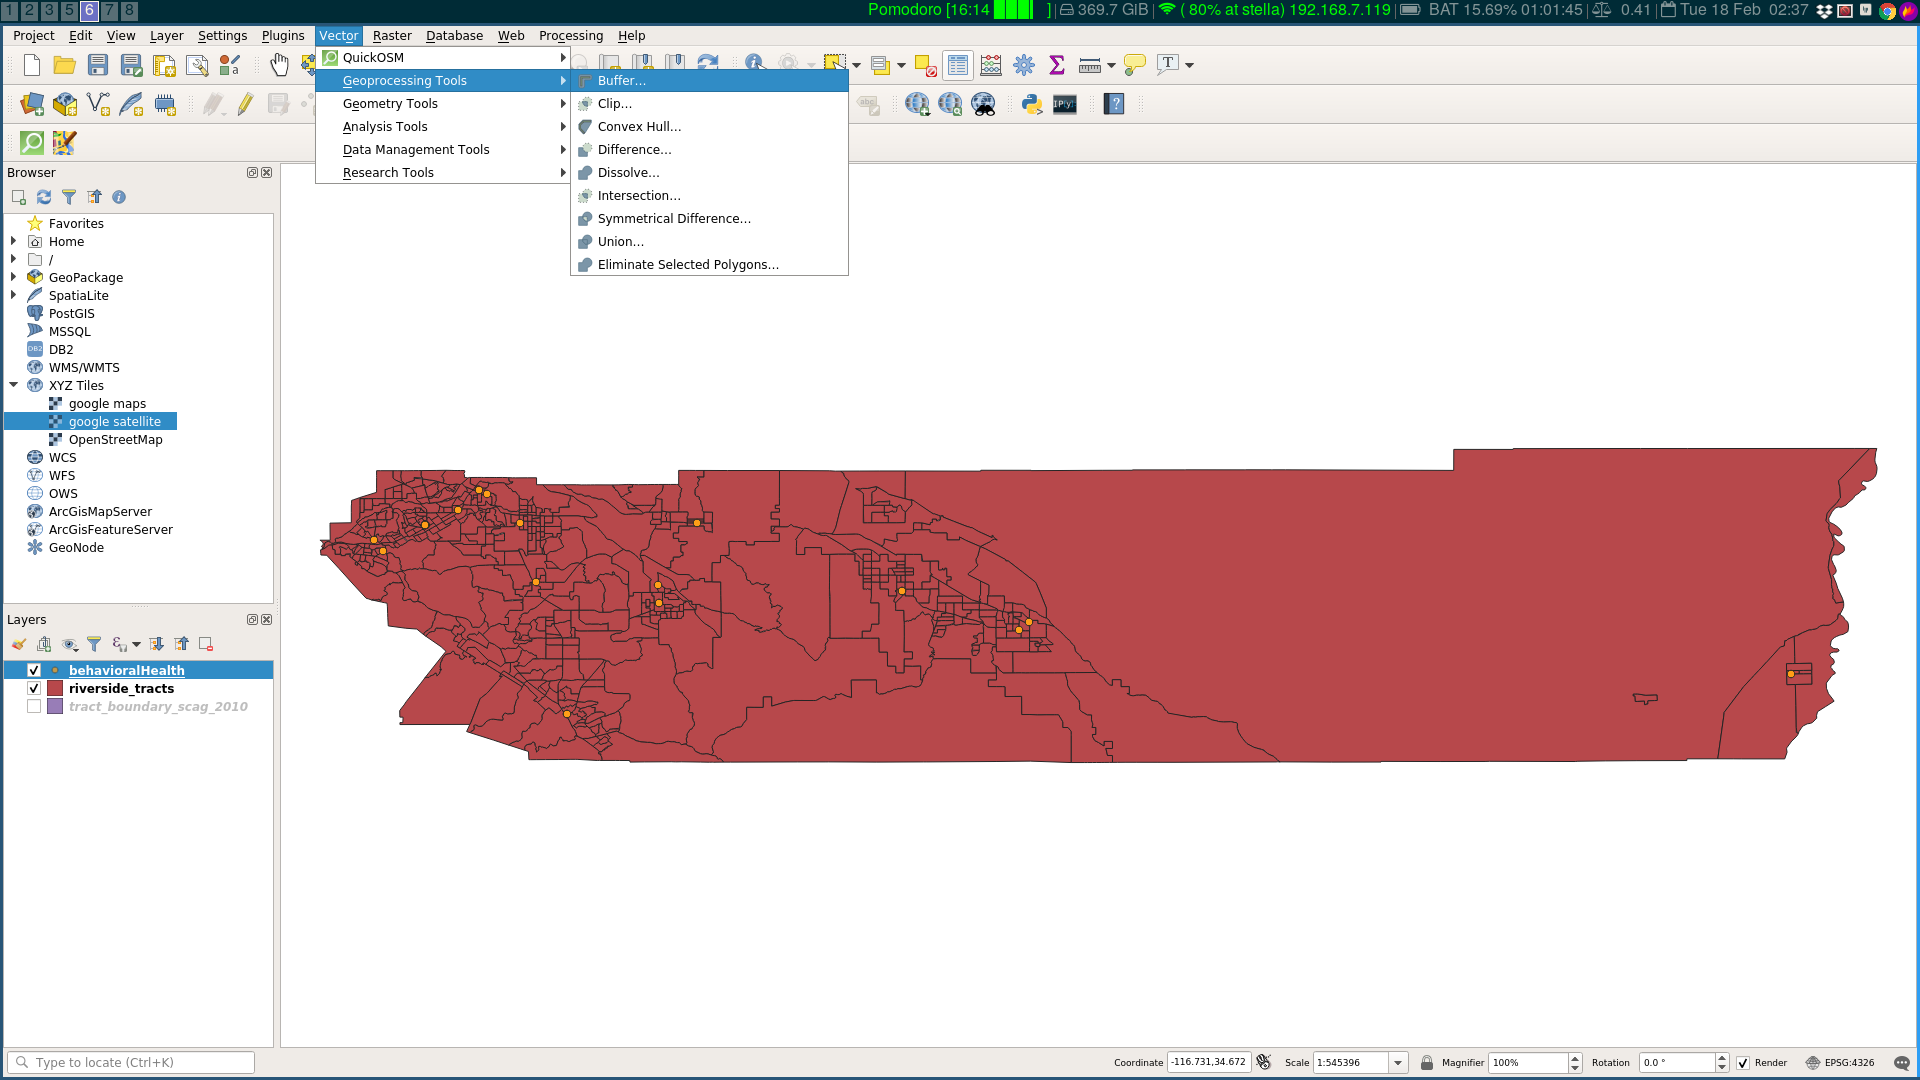
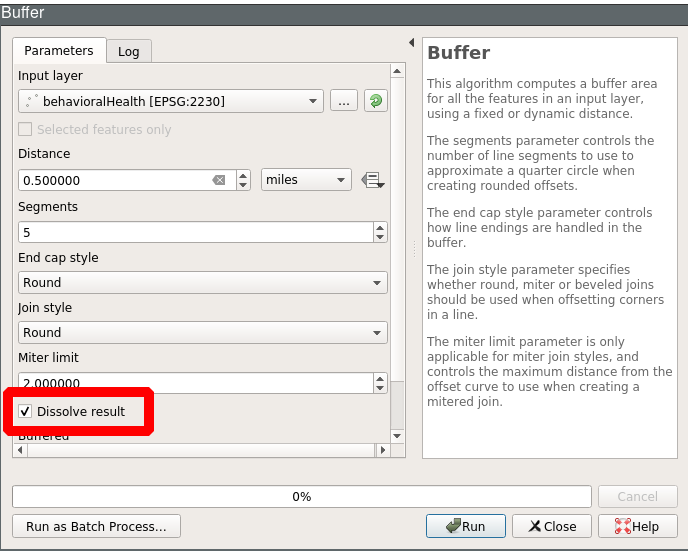
buffer menu
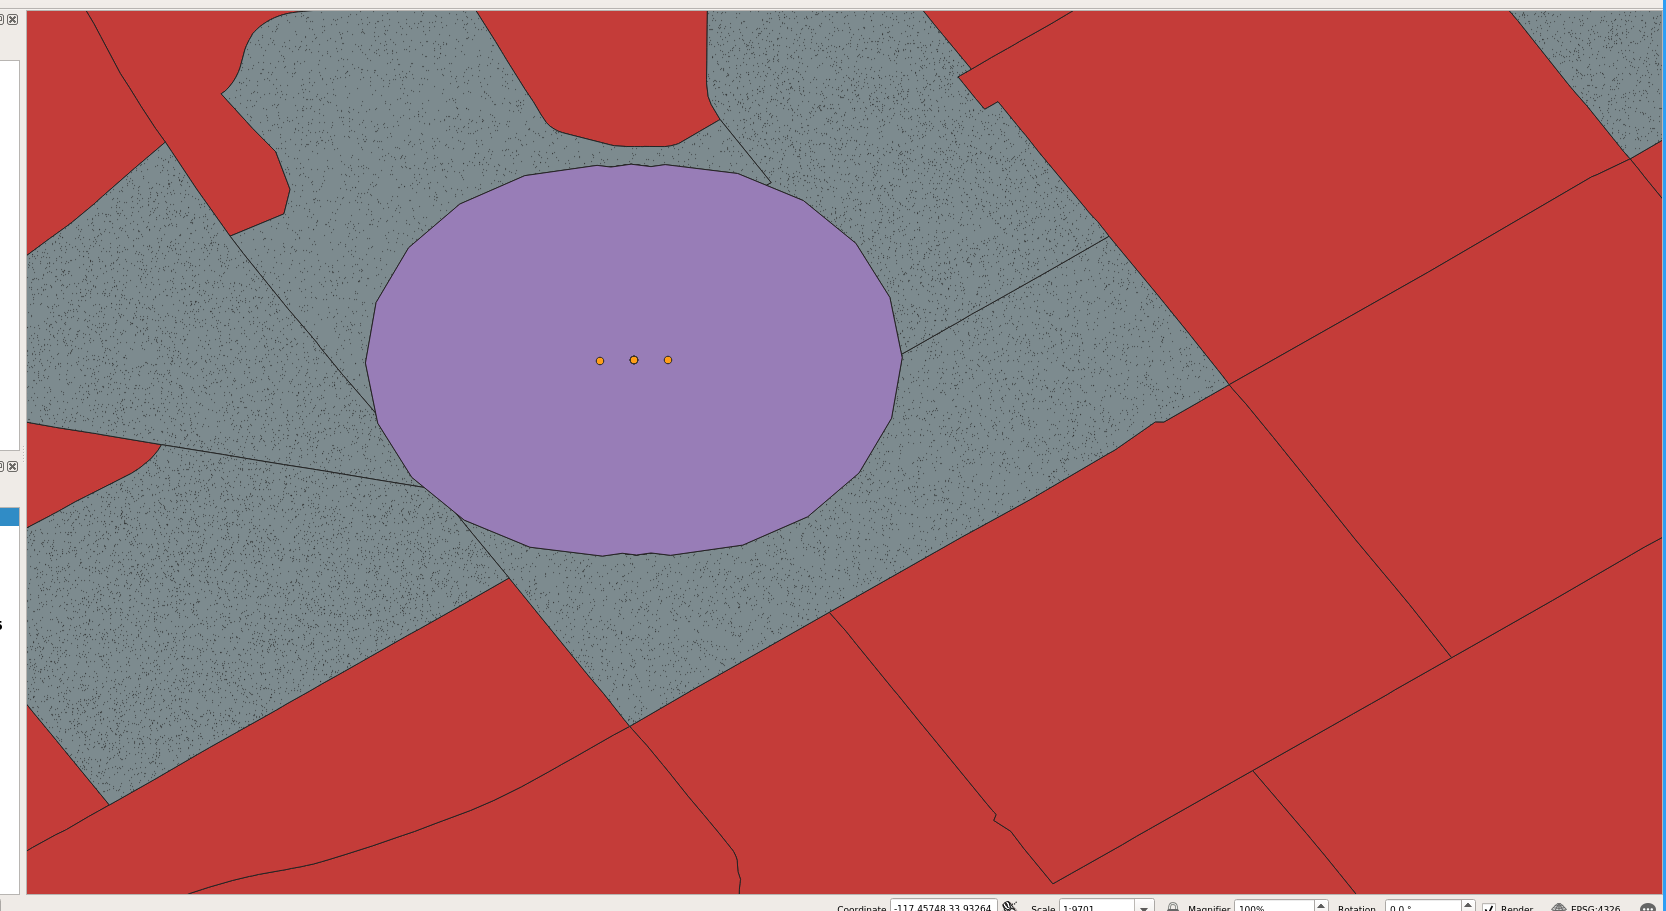
buffer result
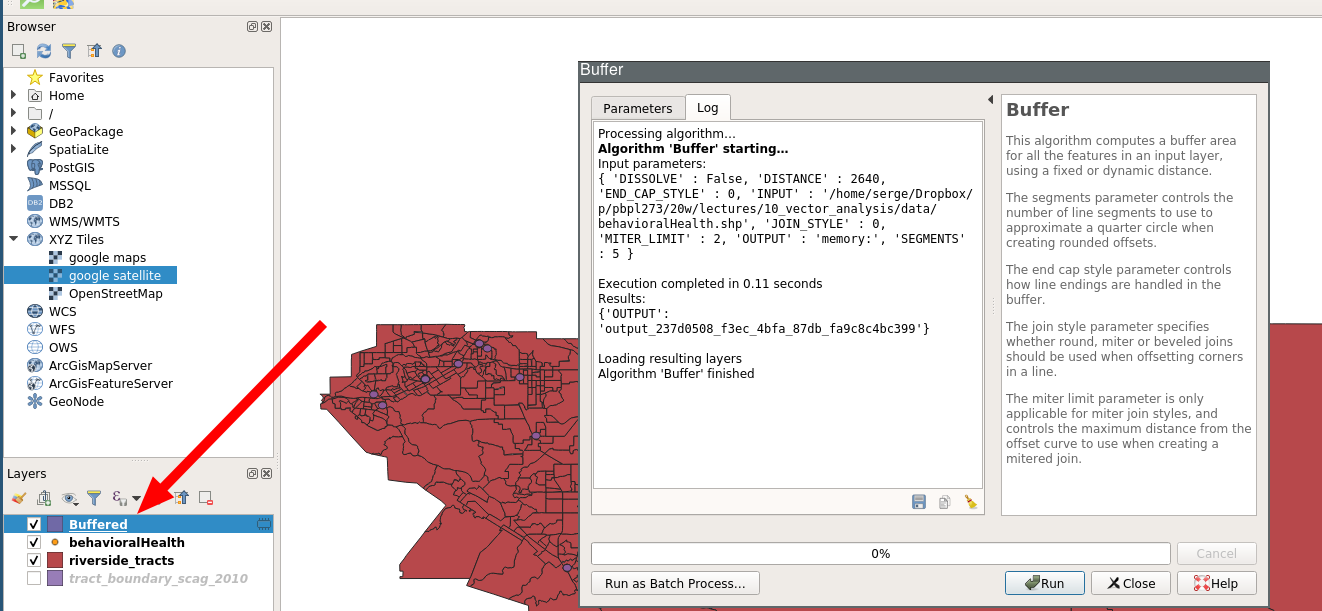
buffer result: geometry
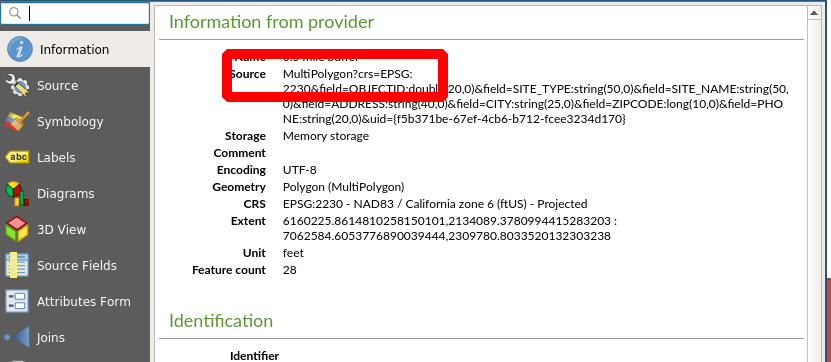
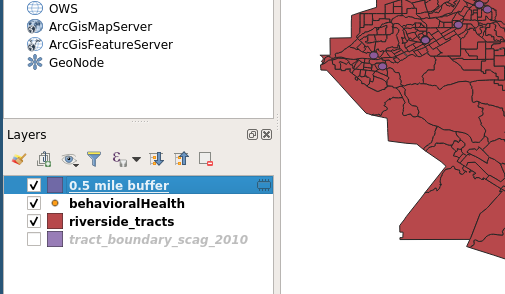
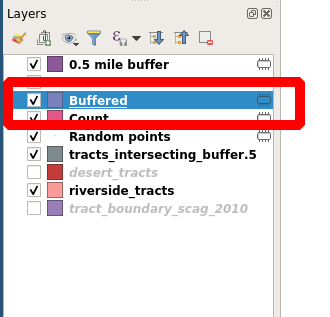
buffer rename
Buffering
Using the Buffers for Locational Analysis
- Find what tracts intersect with the buffers
- Create layer with these tracts
- Use: Select by Location
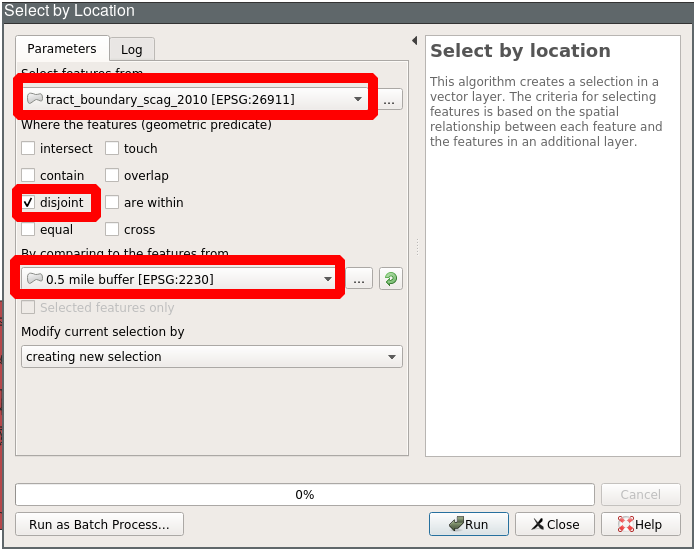
Processing: Select by Location
(Bring up Processing Toolbox with CTRL-ALT-T)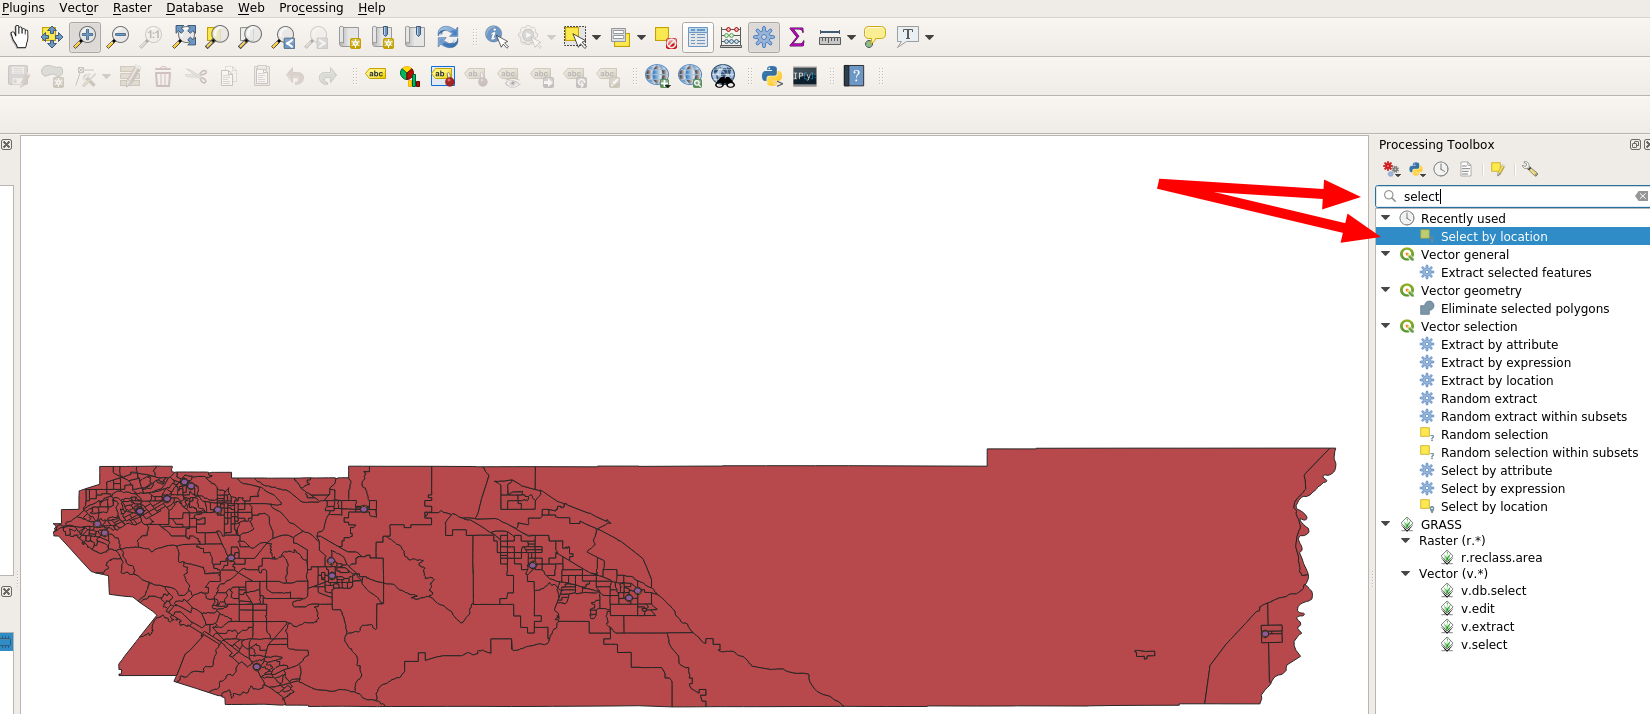
Processing: Select by Location Dialog
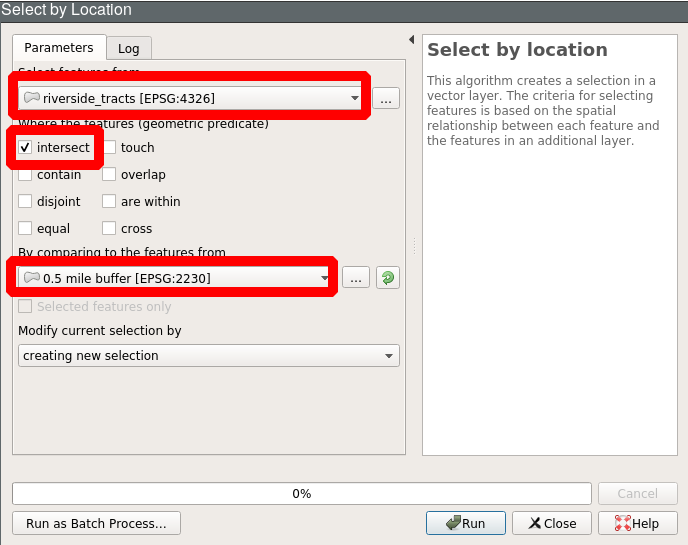
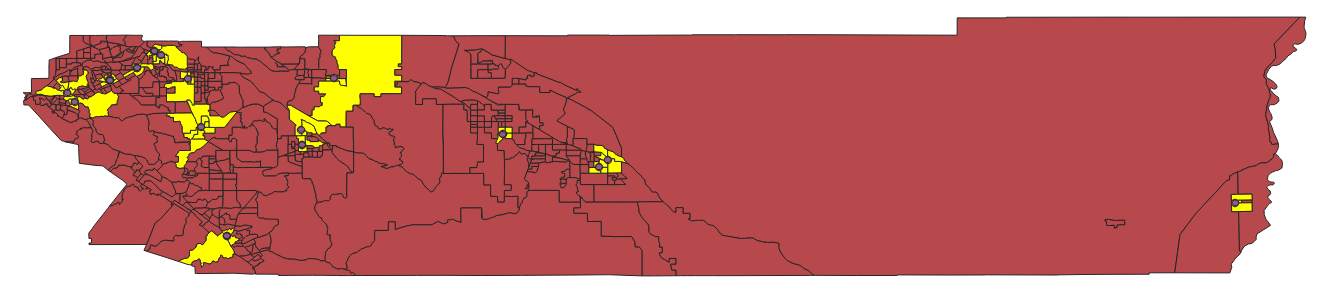
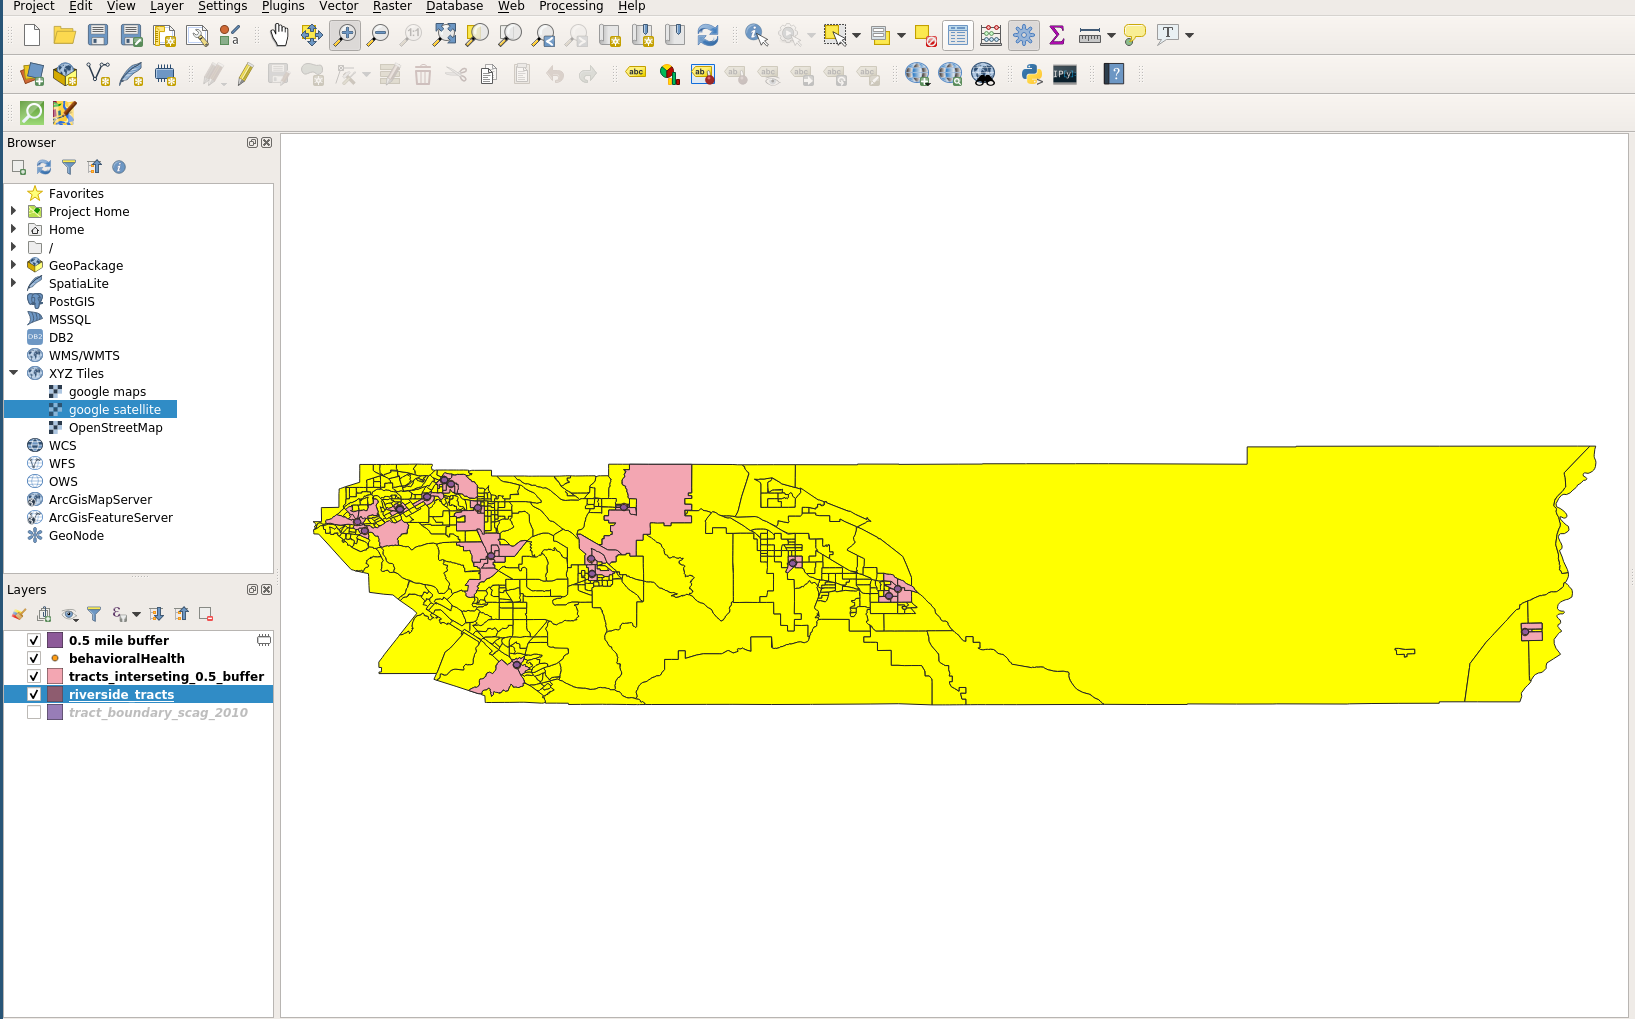
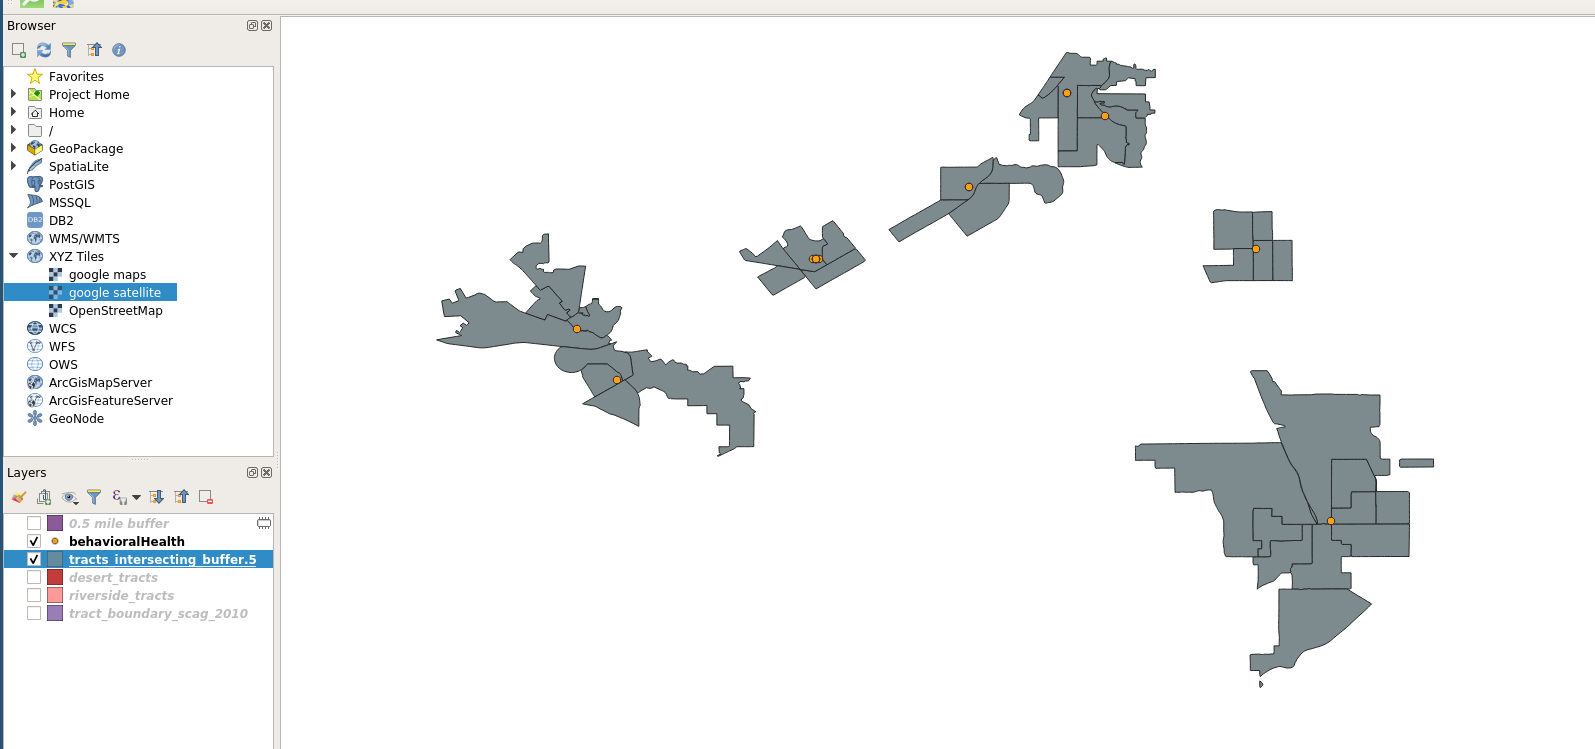
What tracts intersect with the .5 mile buffers?
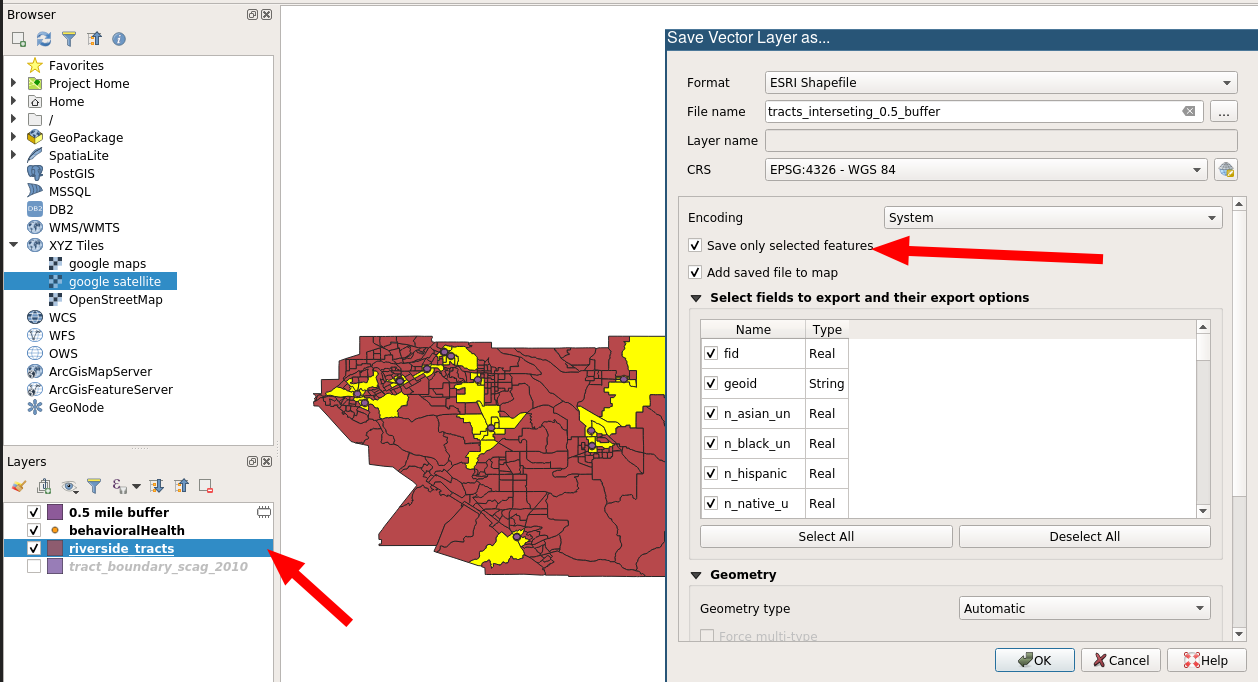
Save Layer
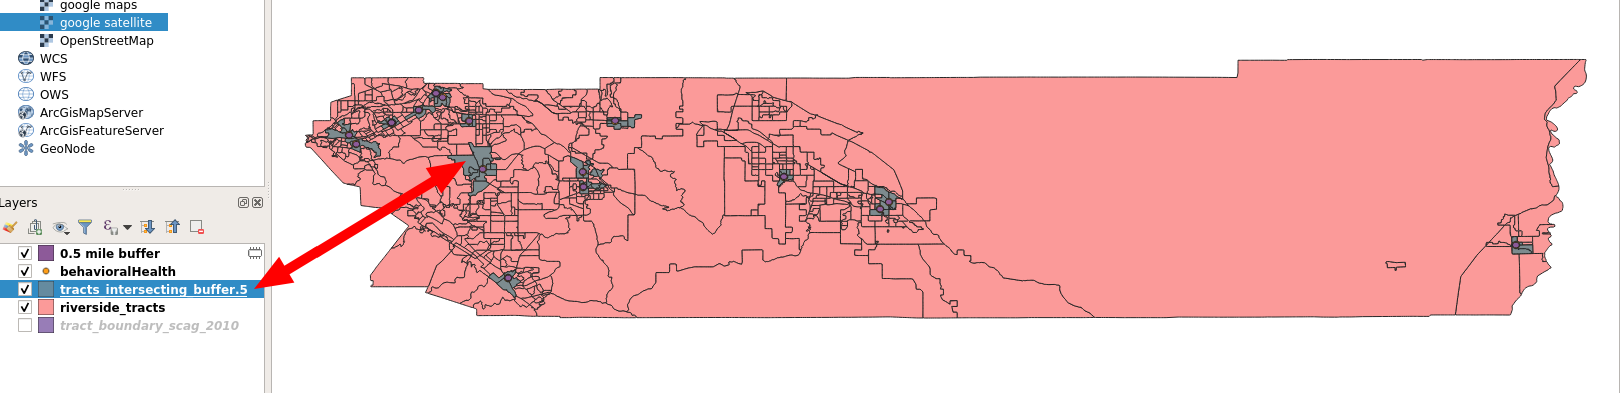
Saved Layer
Health Deserts
Traditional Approach
- Tracts not intersecting buffers
- Add up population in desert polygons
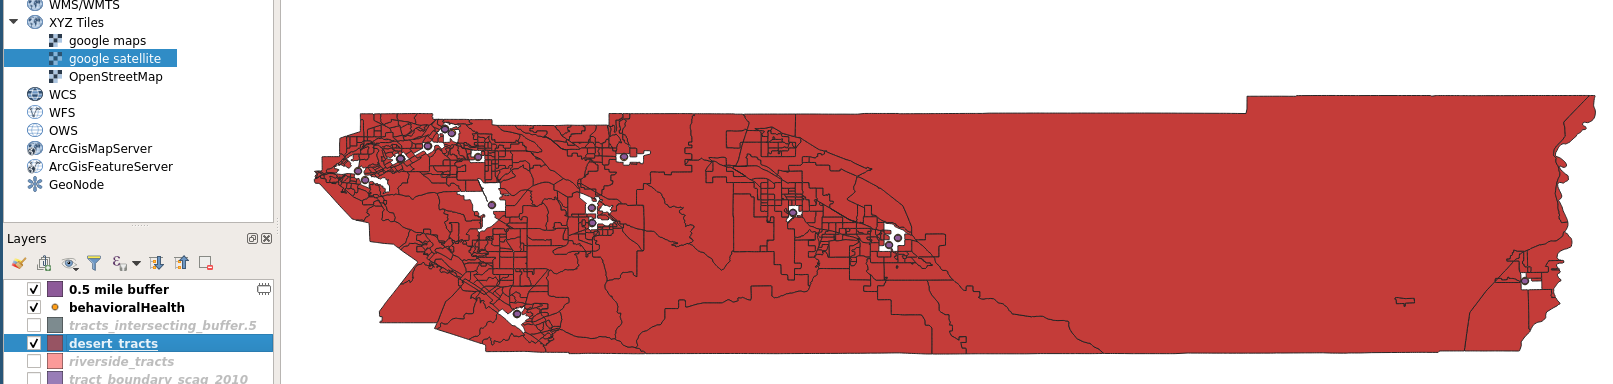
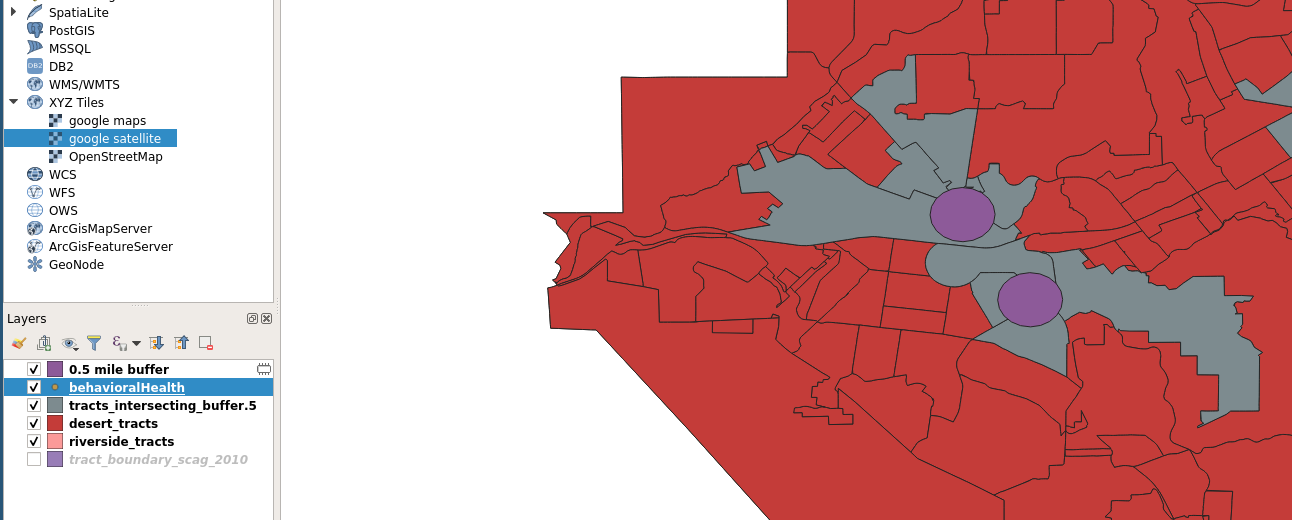
Identifying Clinic Desert Tracts
Clinic Desert
Clinic Desert Layer
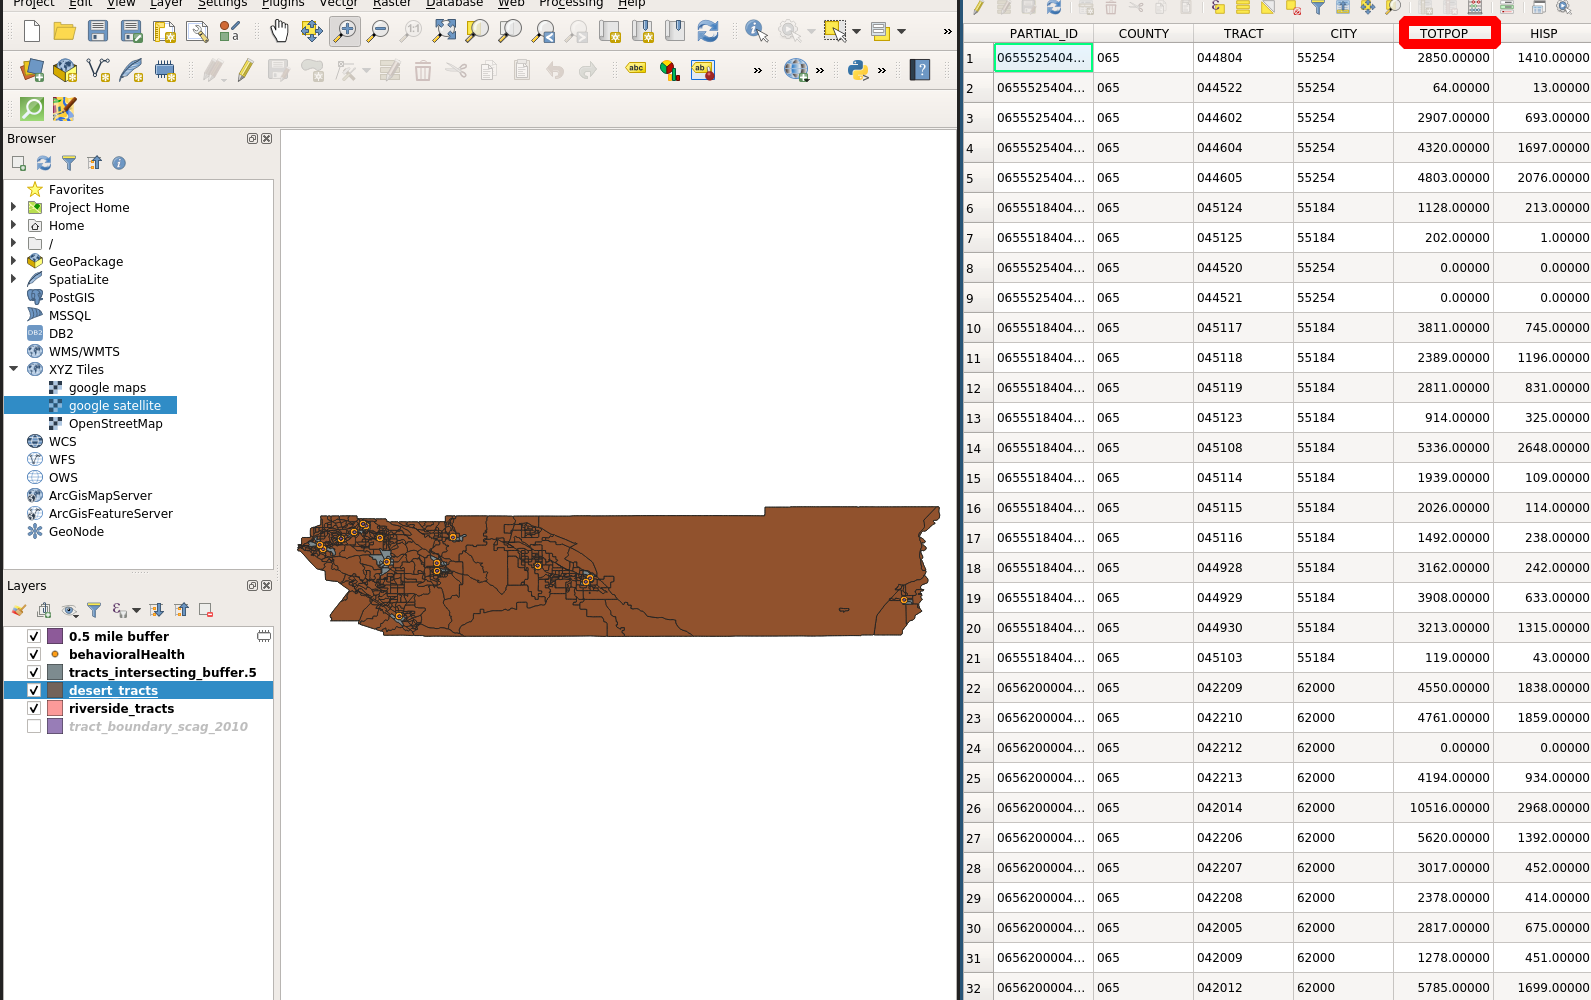
What is the population residing in Clinic Desert?
Desert Tracts Tables
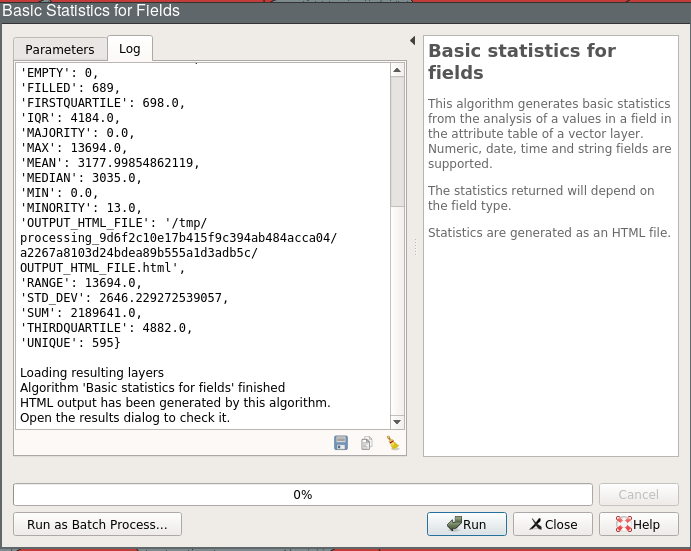
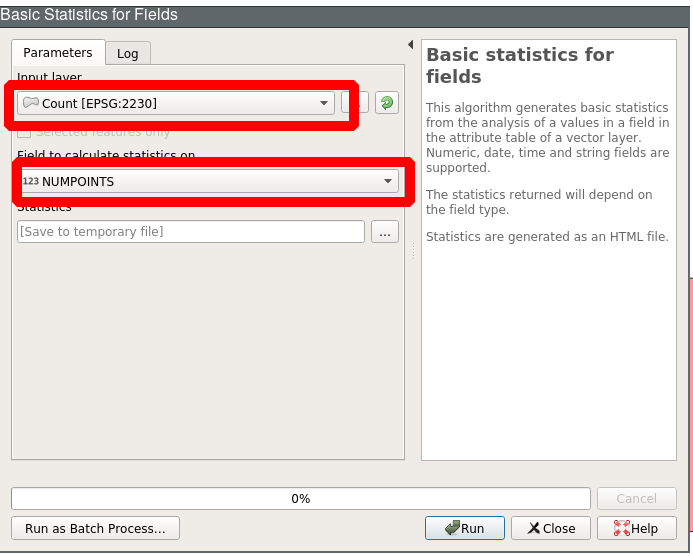
Basic Statistics for Fields
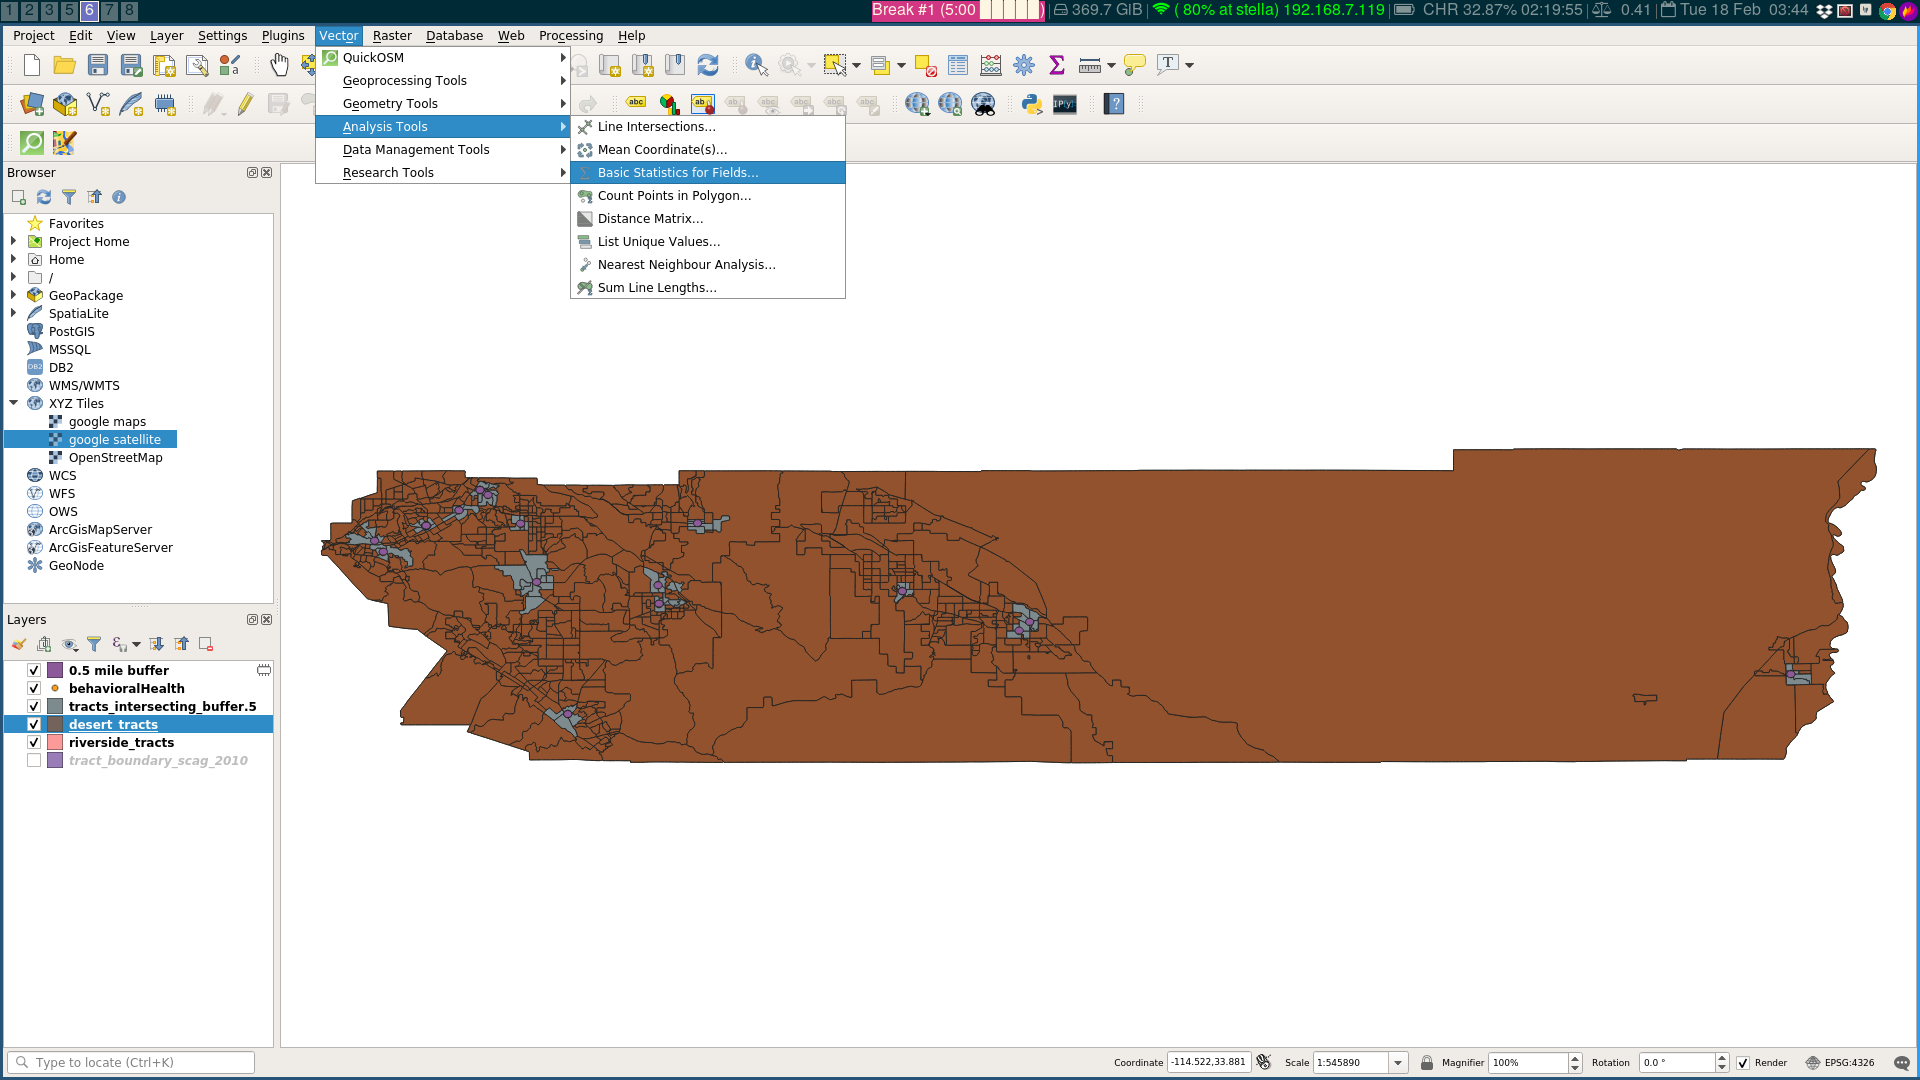
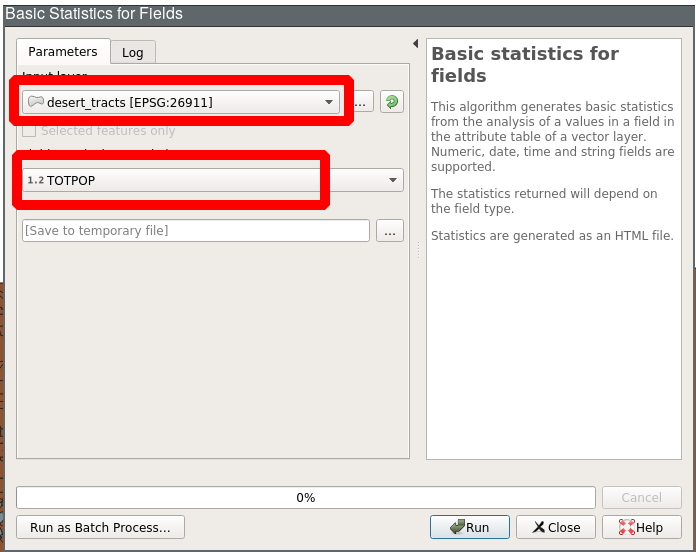
Basic Statistics for Fields: Dialog
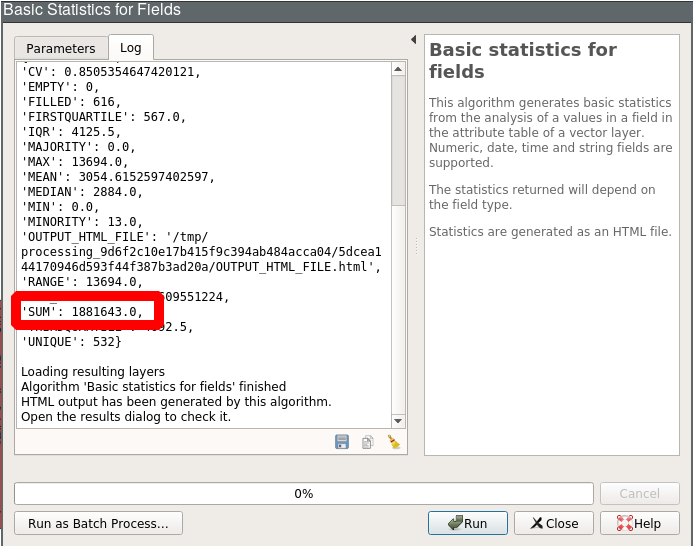
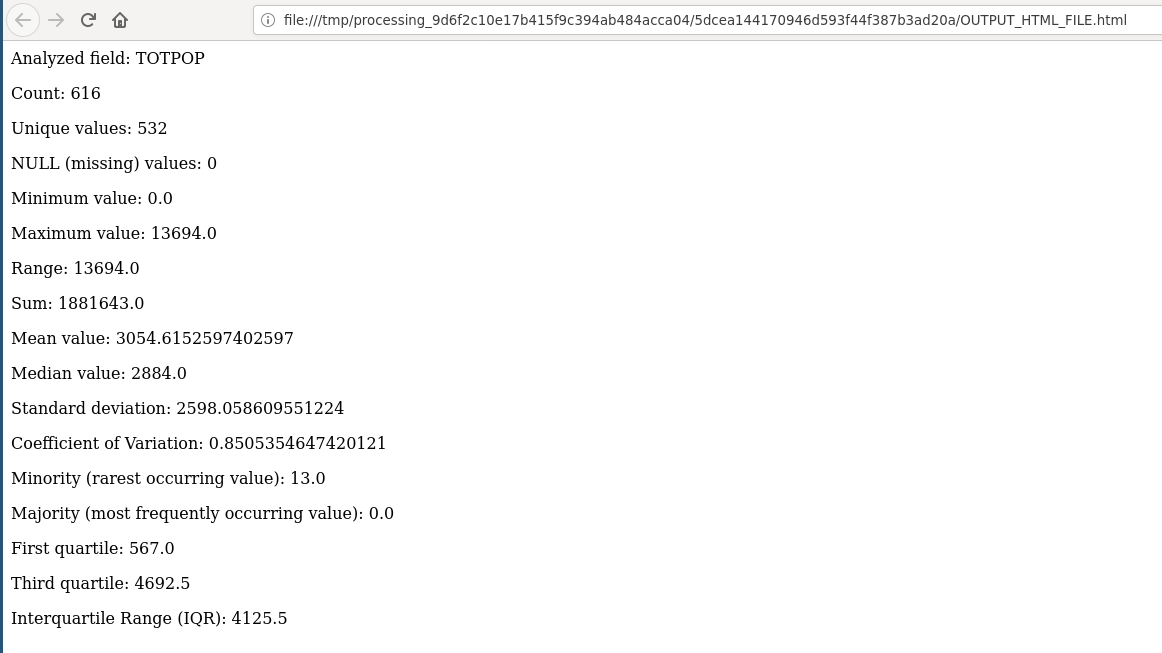
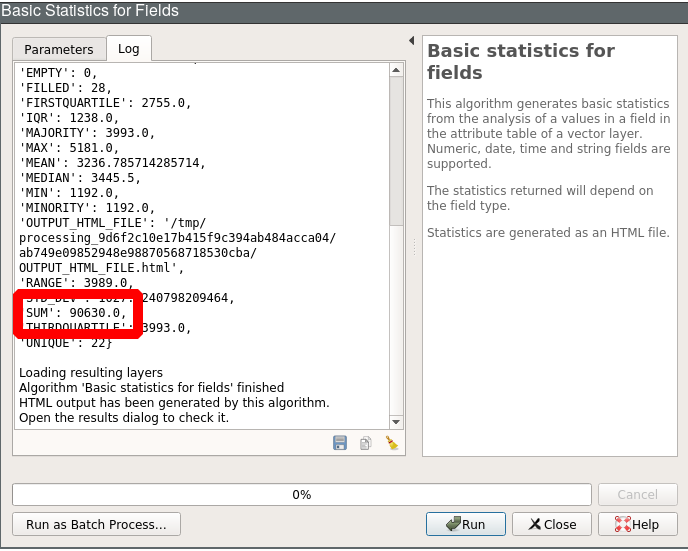
Basic Statistics for Fields: Results
Basic Statistics for Fields: File
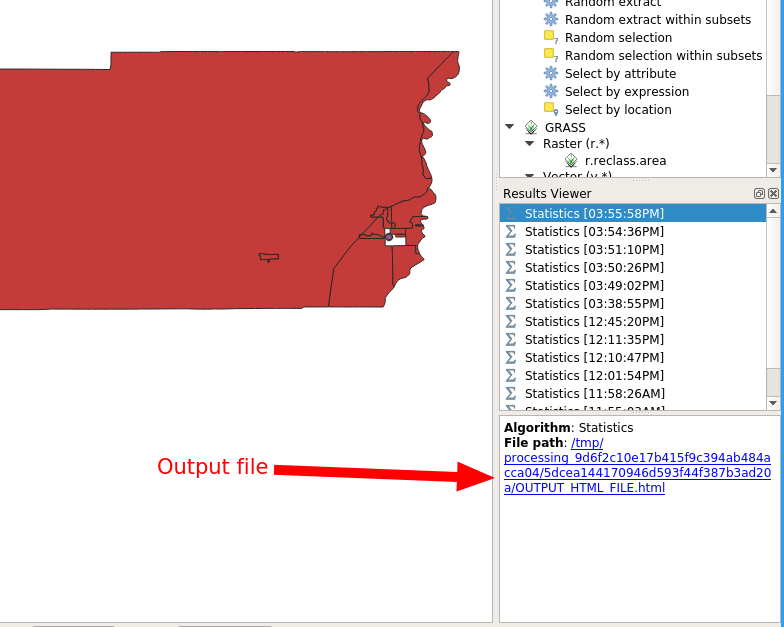
Basic Statistics for Fields: File
Total County Tract Population
Population Estimates
- County Total: 2,189,641
- In Clinic Desert Tracts: 1,881,643
- In Buffer Tracts: 307,998
- Population with access problems: 1,881,643
Issues in measuring access to clinics
- all individuals in the tracts intersecting the buffers are in the buffer
- overestimation of people within .5 miles of a clinic
- underestimation of people in the clinic desert
Why overestimation of buffer population?
We can do better
Buffer Tracts
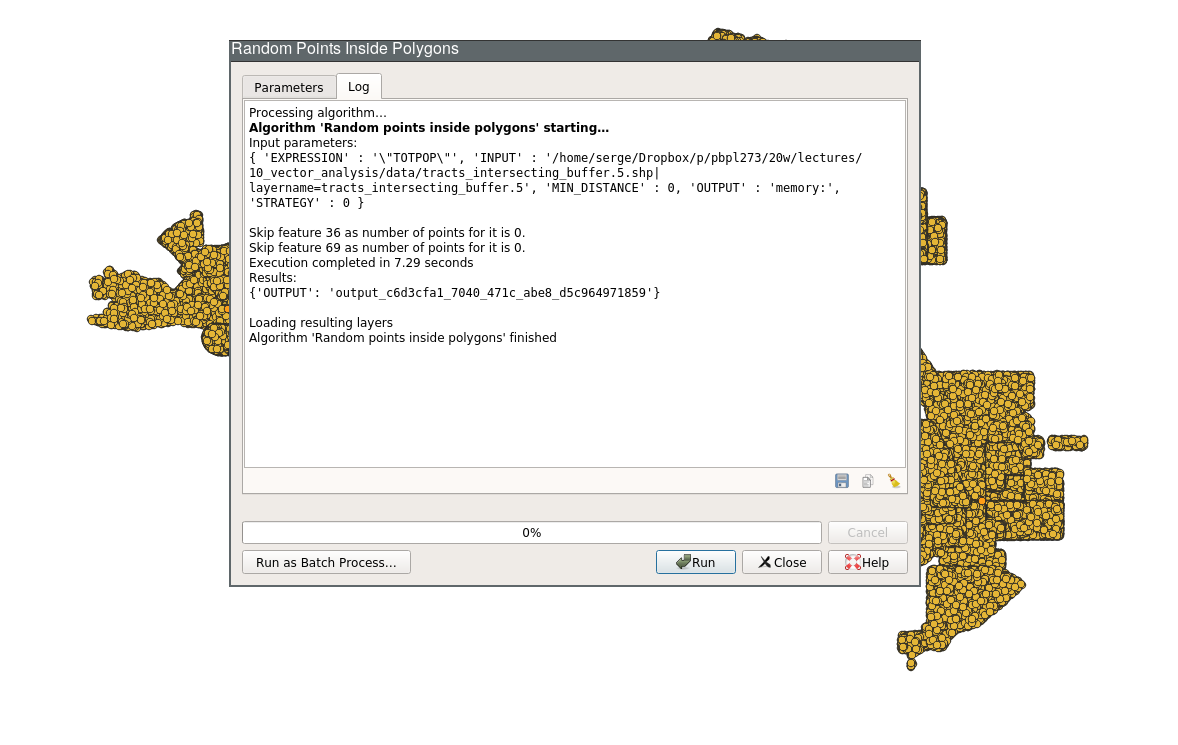
Random Points
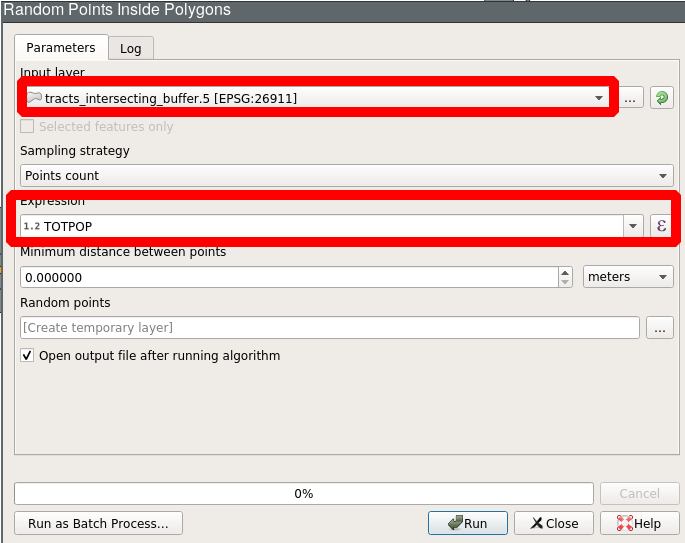
Random Points Generated
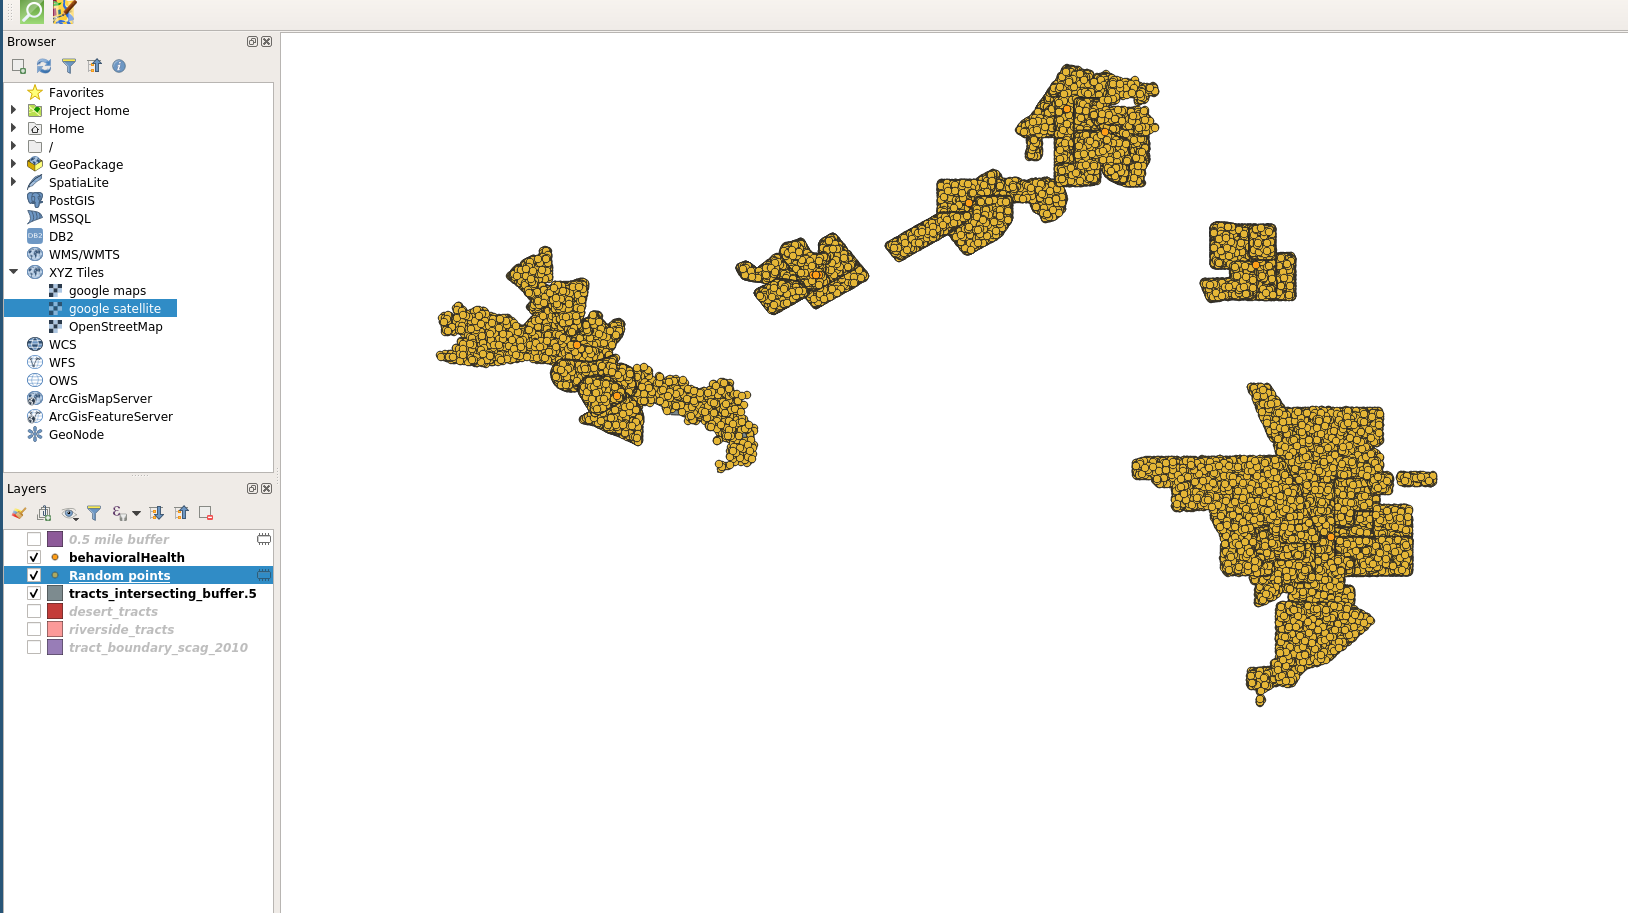
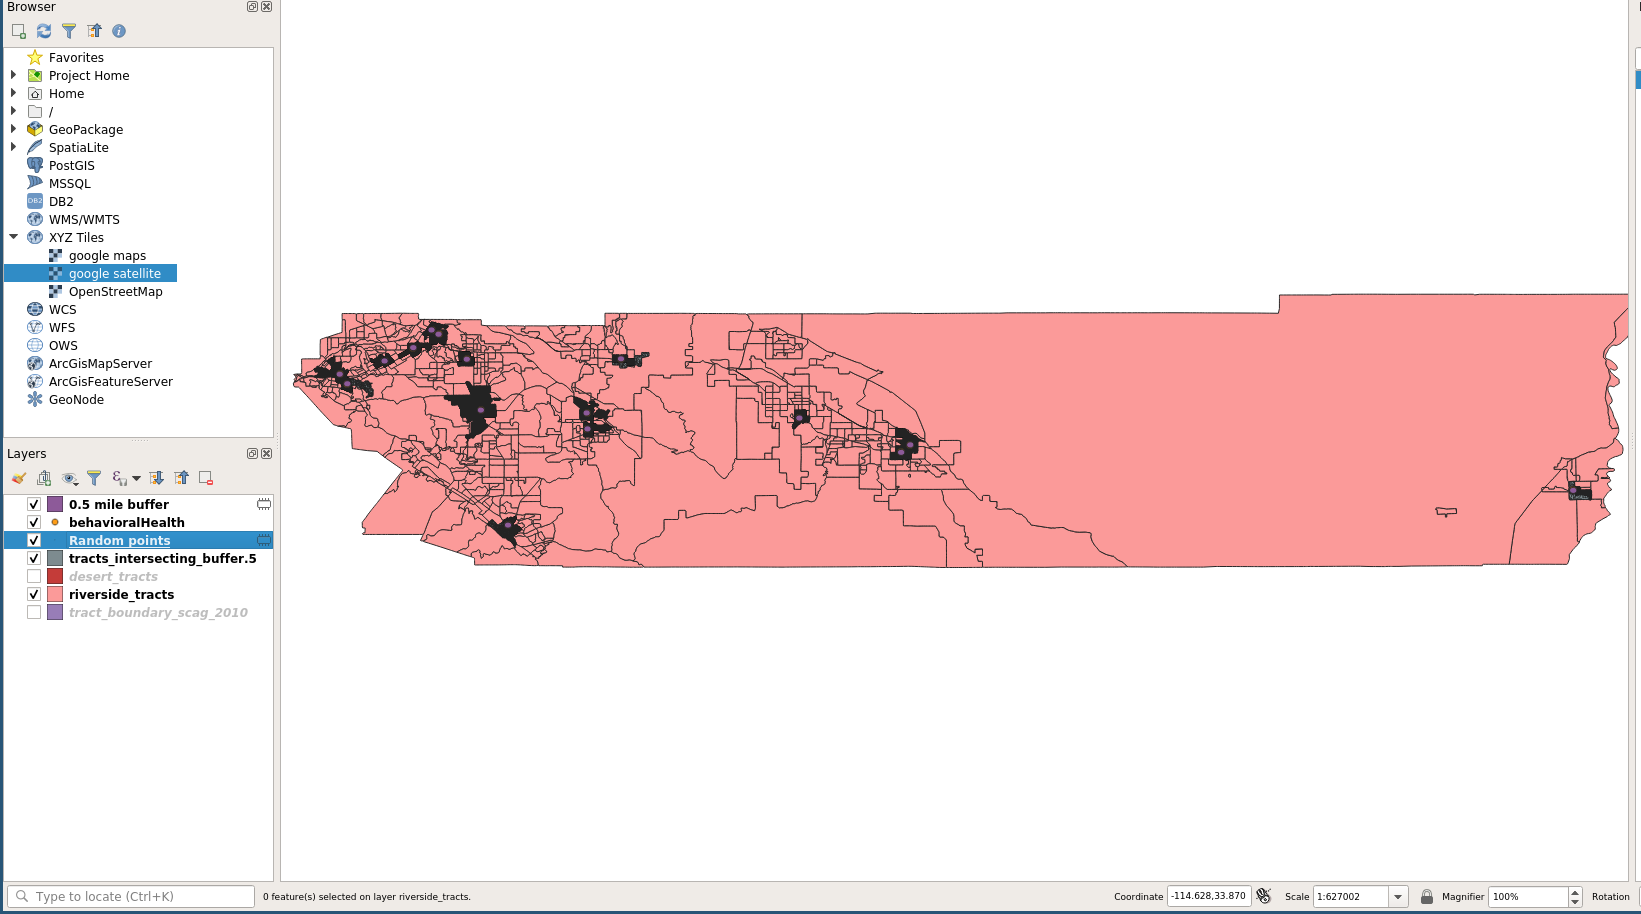
Random Points Layer
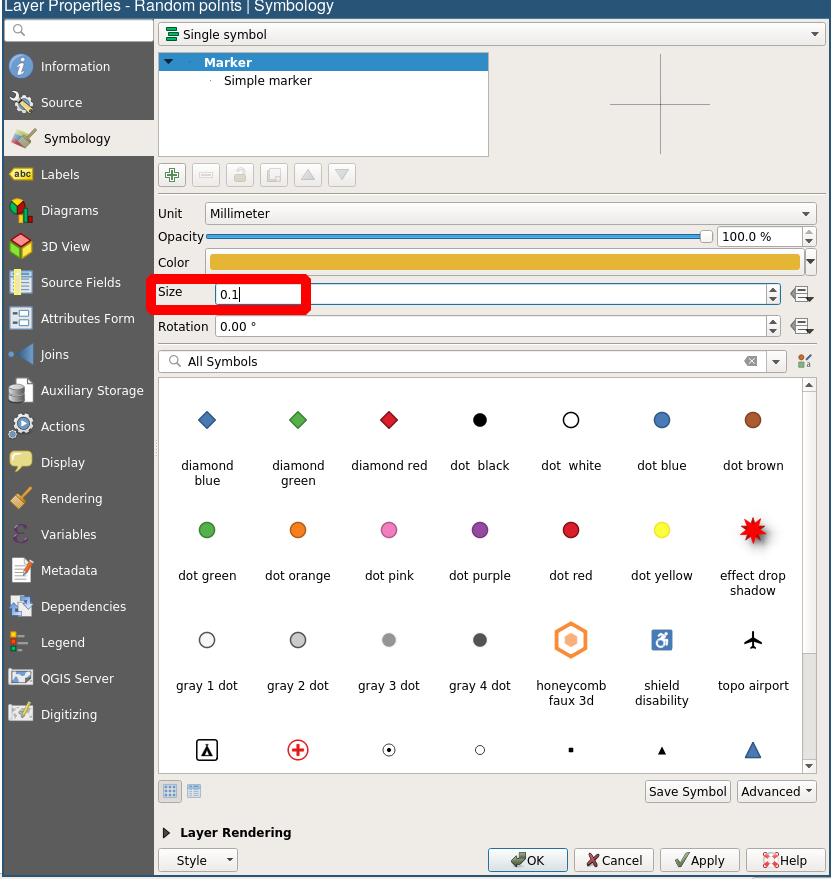
Random Points Layer Symbology
Random Points Layer
Count points in buffers: Layers
Count points in buffers
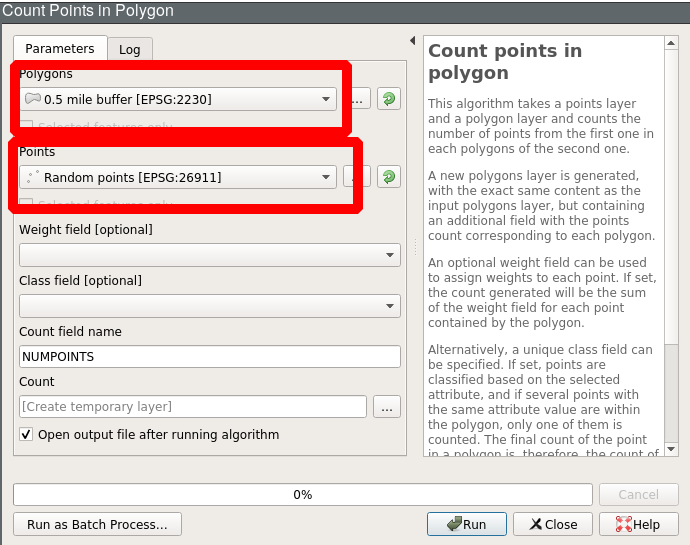
Points in polygons
Count Field
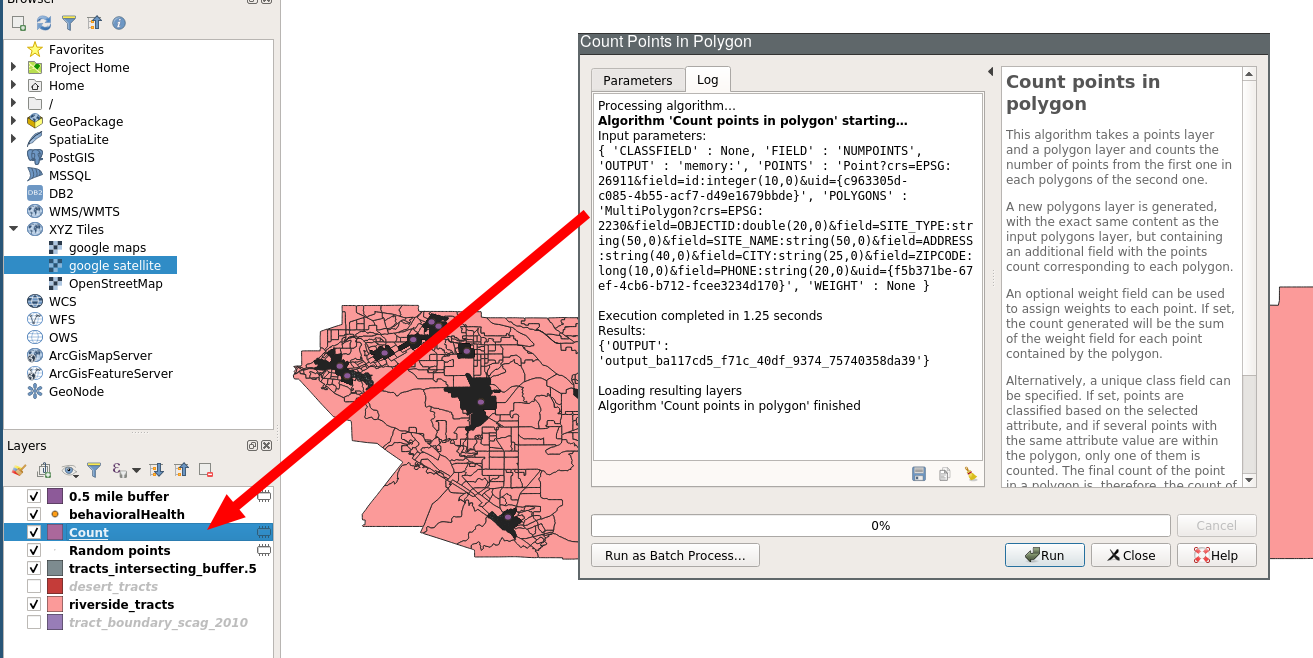
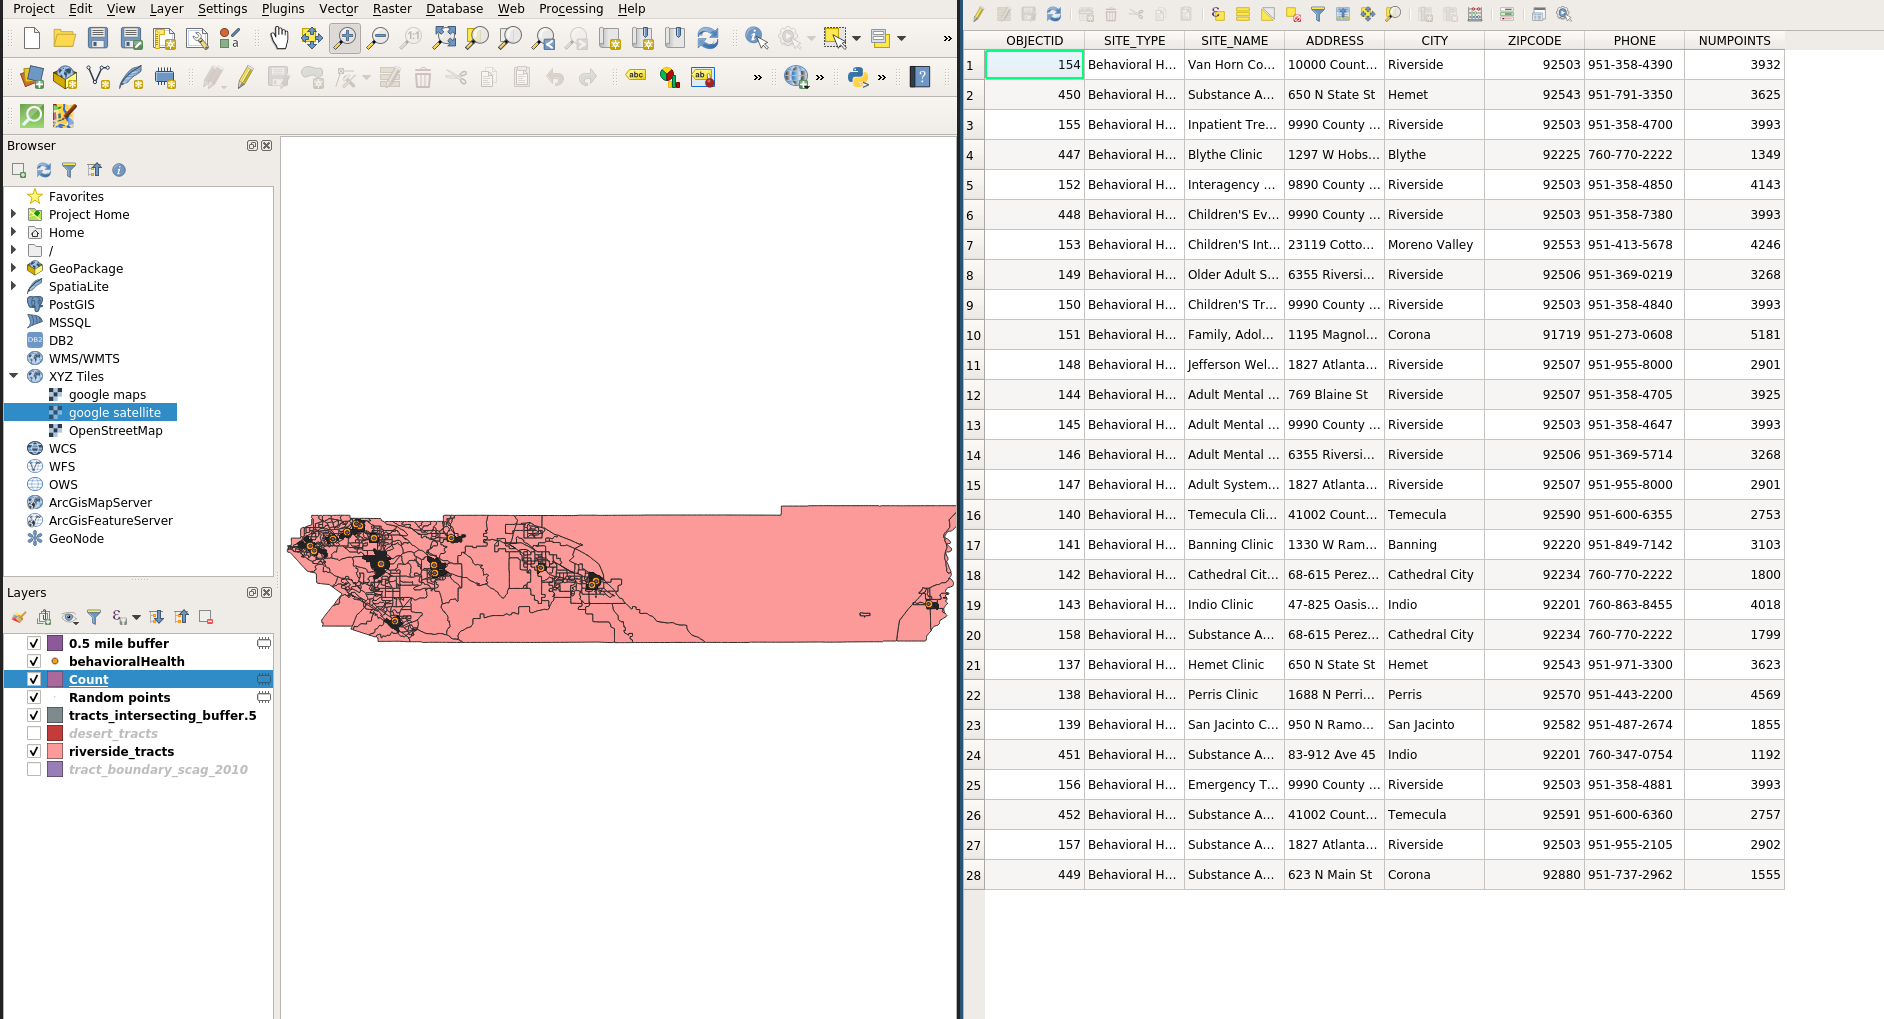
Count Summary
Count Table
Revised Estimates
- County Total: 2,189,641
- In Clinic Desert Tracts: 1,881,643
- In Buffer Tracts: 307,998
- 90,630 in buffer, in tract
- 217,358 out of buffer, in tract
- Population with access problems: 2,099,011
- Population within .5 miles of clinic: 90,630
Issue
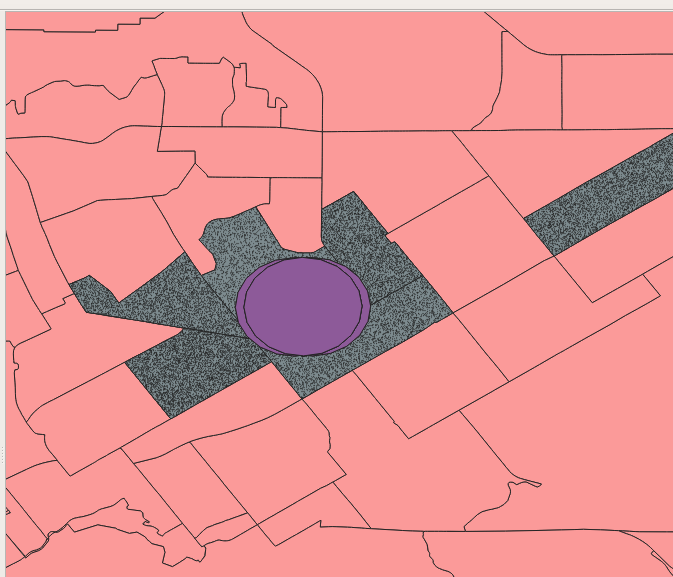
- double counting
- points contained in more than a single buffer are counted more than once
Overlapping Buffers
Count Table With Overlapping Buffers
Fix
- dissolve on buffering
Buffer and Dissolve
Dissolved Buffer
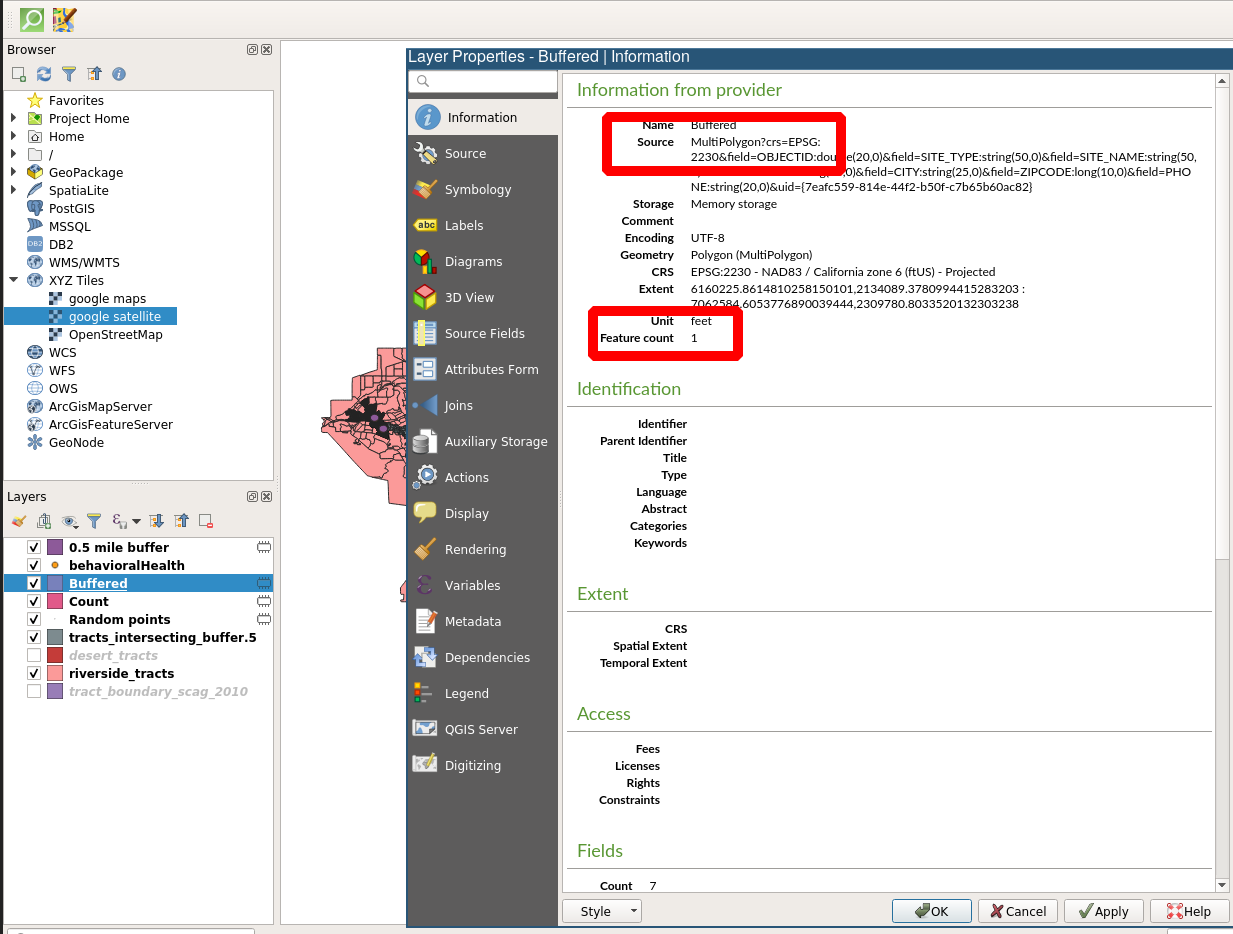
New Buffer
New Buffer Feature Count
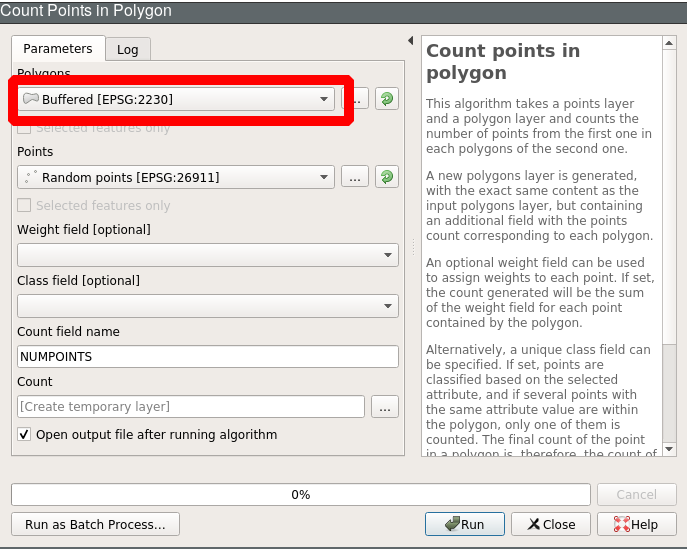
Points in Polygon Count
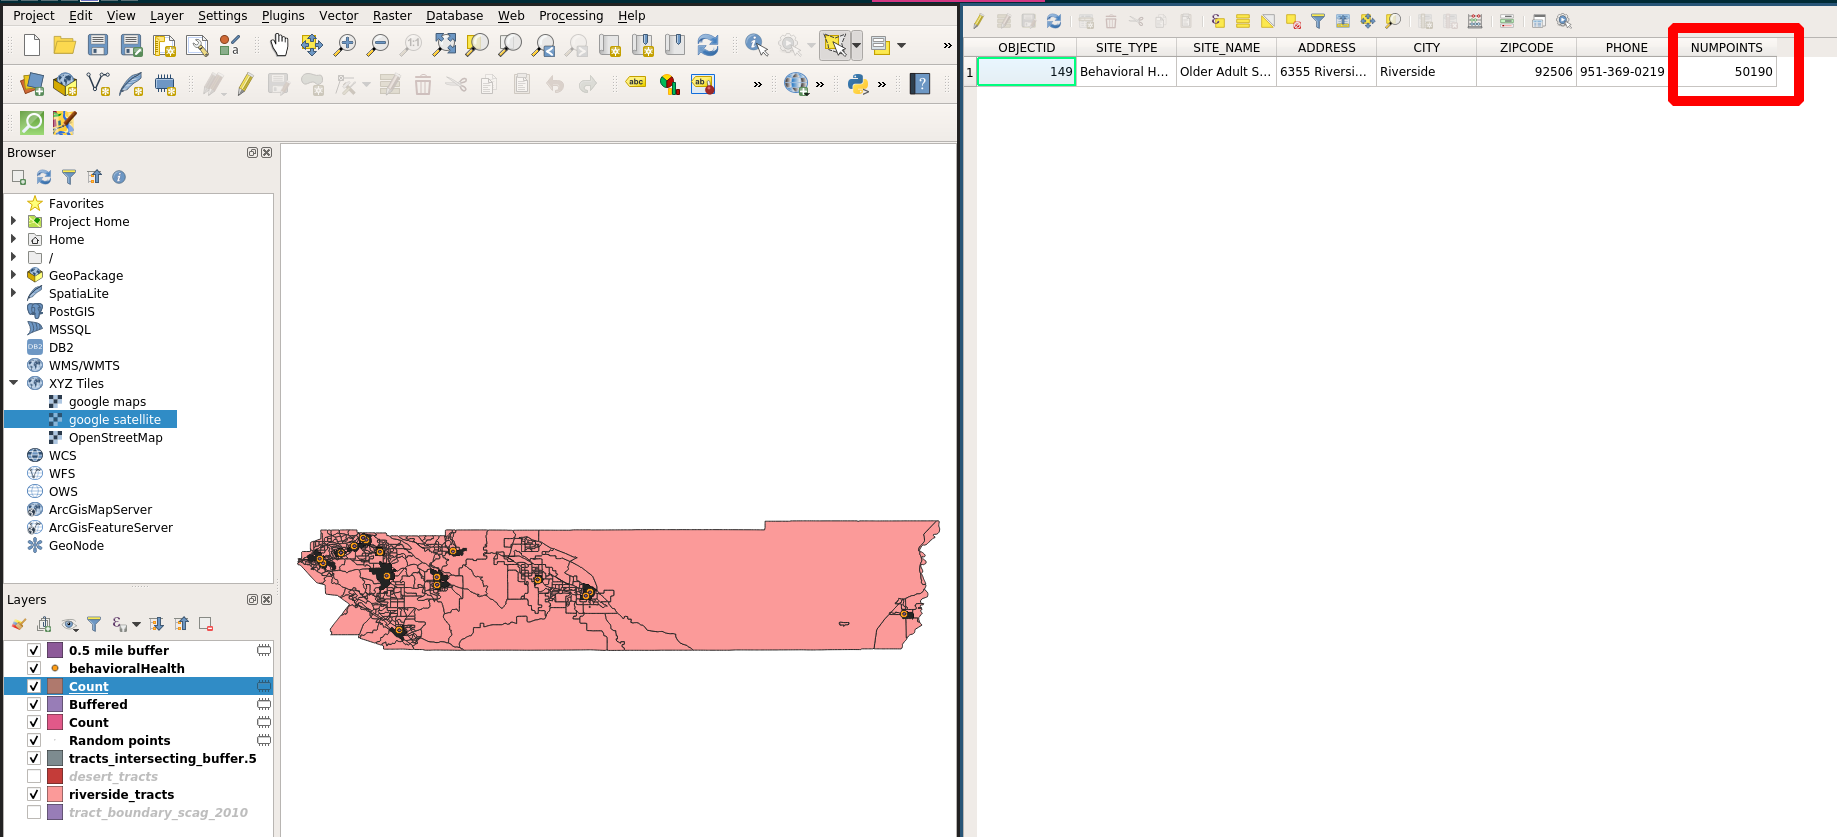
Population within .5 Miles of a Clinic
Revised Estimates
- County Total: 2,189,641
- In Clinic Desert Tracts: 1,881,643
- In Buffer Tracts: 307,998
- 50,190 in buffer, in tract (no double counting)
- 257,808 out of buffer, in tract
- Population with access problems: 2,139,451
- Population within .5 miles of clinic: 50,190
Next Up
- Vector Analysis: Clipping and Spatial Joins

GIS for Public Policy’20 by Sergio Rey is licensed under a Creative Commons Attribution-ShareAlike 4.0 International License.