Geographic Information Systems for Public Policy - Lecture VIII
Creating Maps
Sergio Rey
Last Time
- Midterm Exam
Today
- Working with Vector Data
- Symbology
- Classifying Vector Data
- Color
Working with Vector Data
Shapefile
Geopackage
- open format
- multiple layers
- different geometries
- can contain vector and raster layers
- different coordinate systems
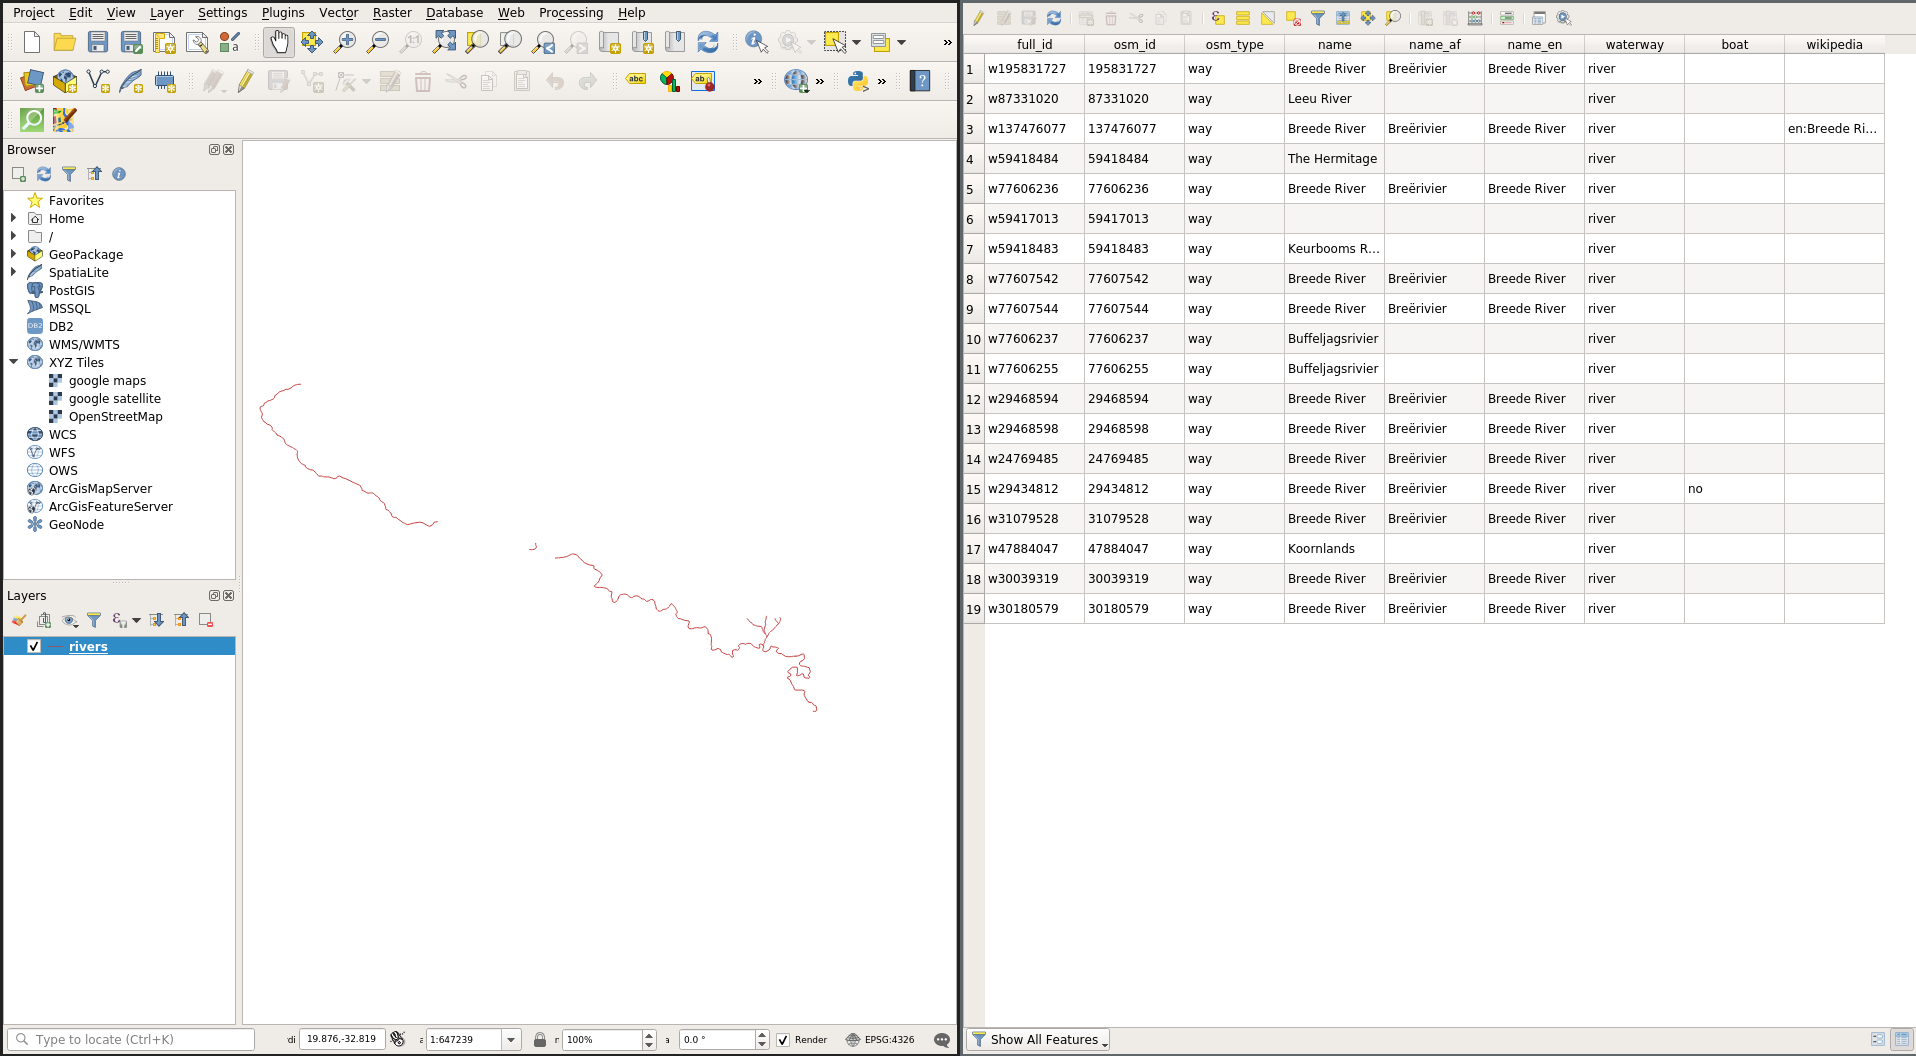
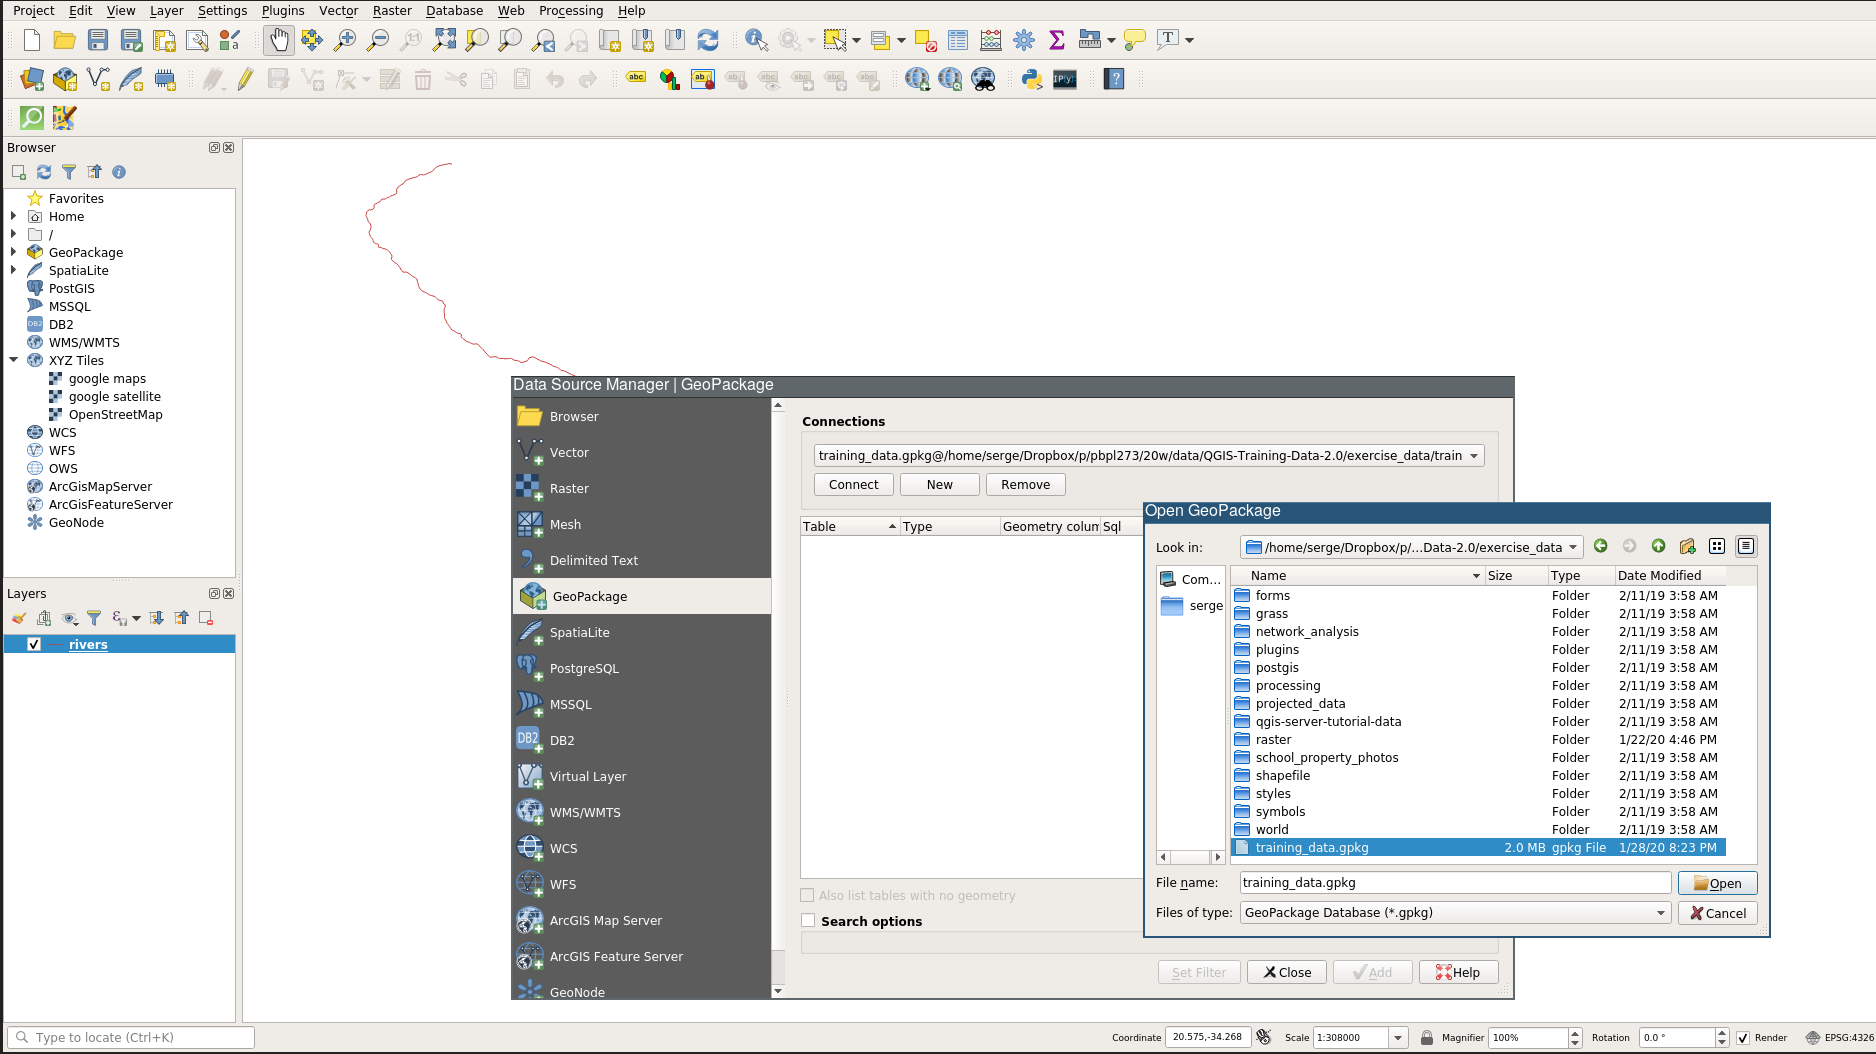
Geopackage
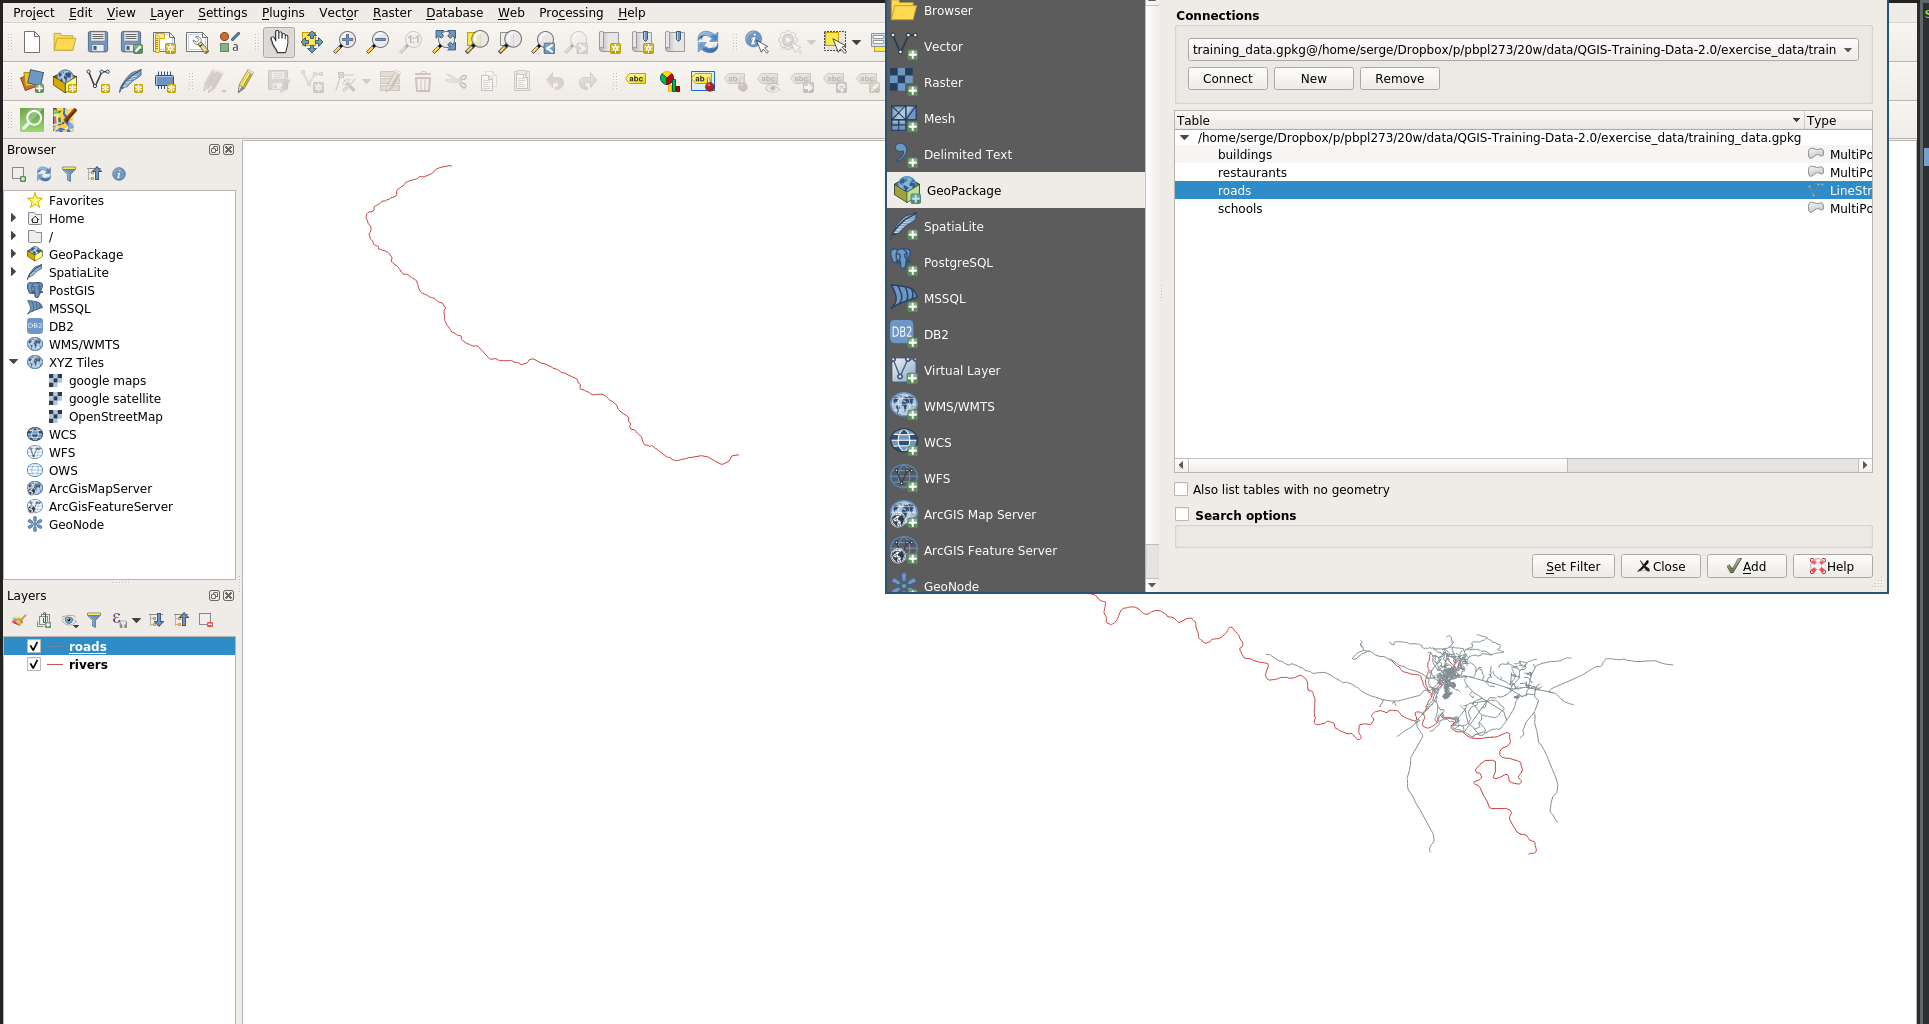
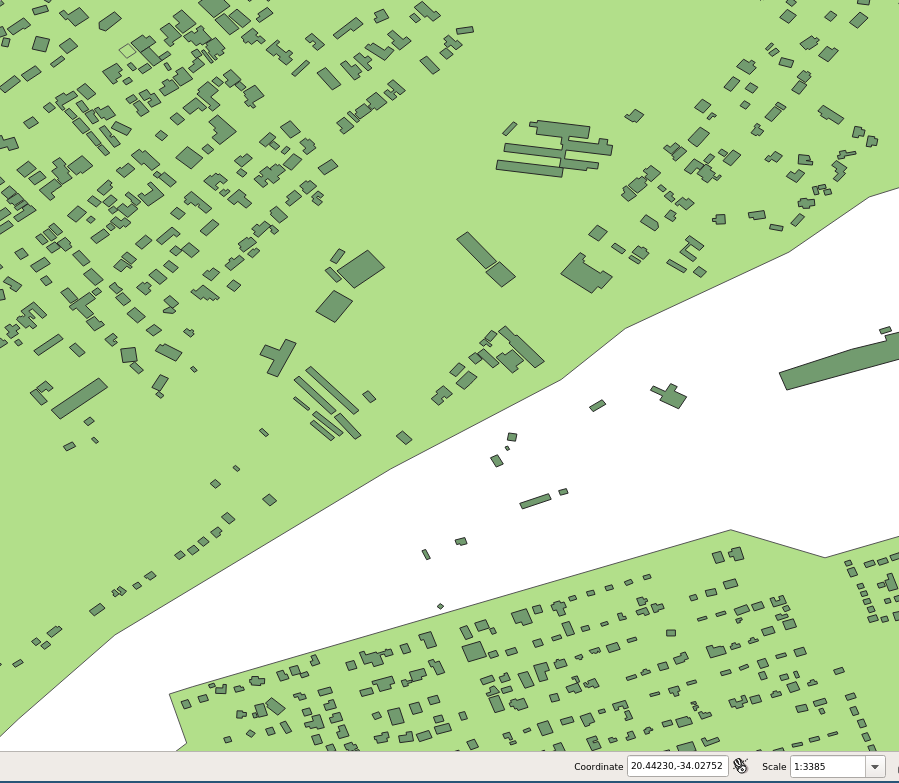
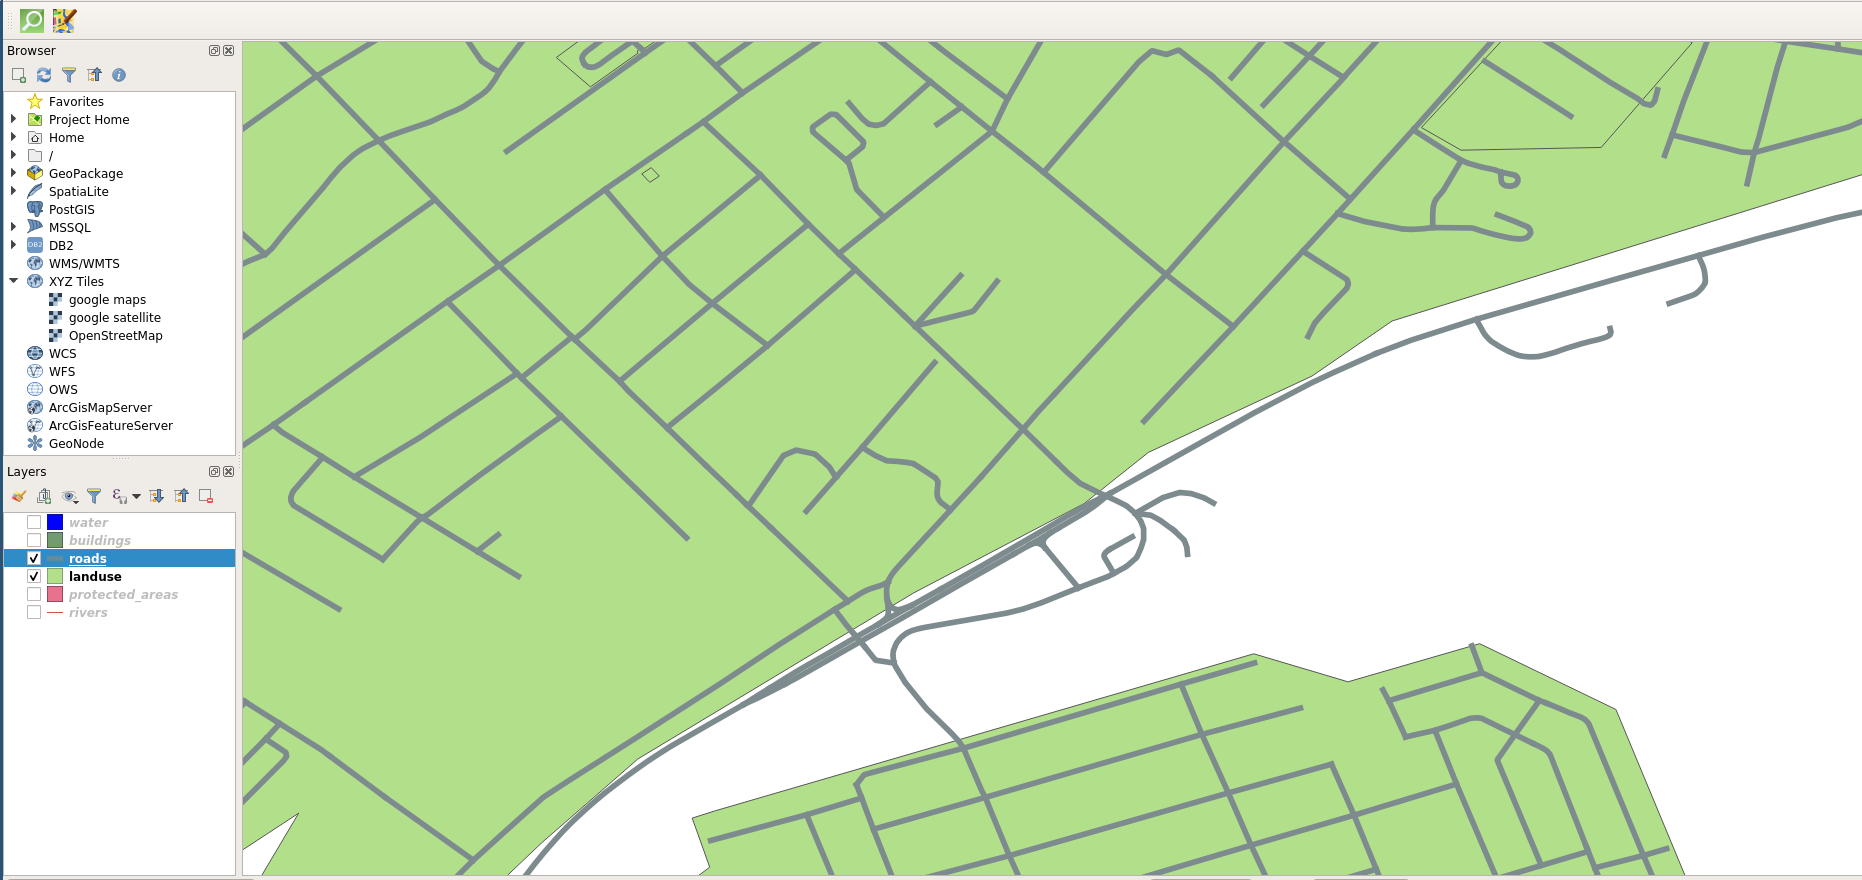
Geopackage: Roads
SQLite
SQLite
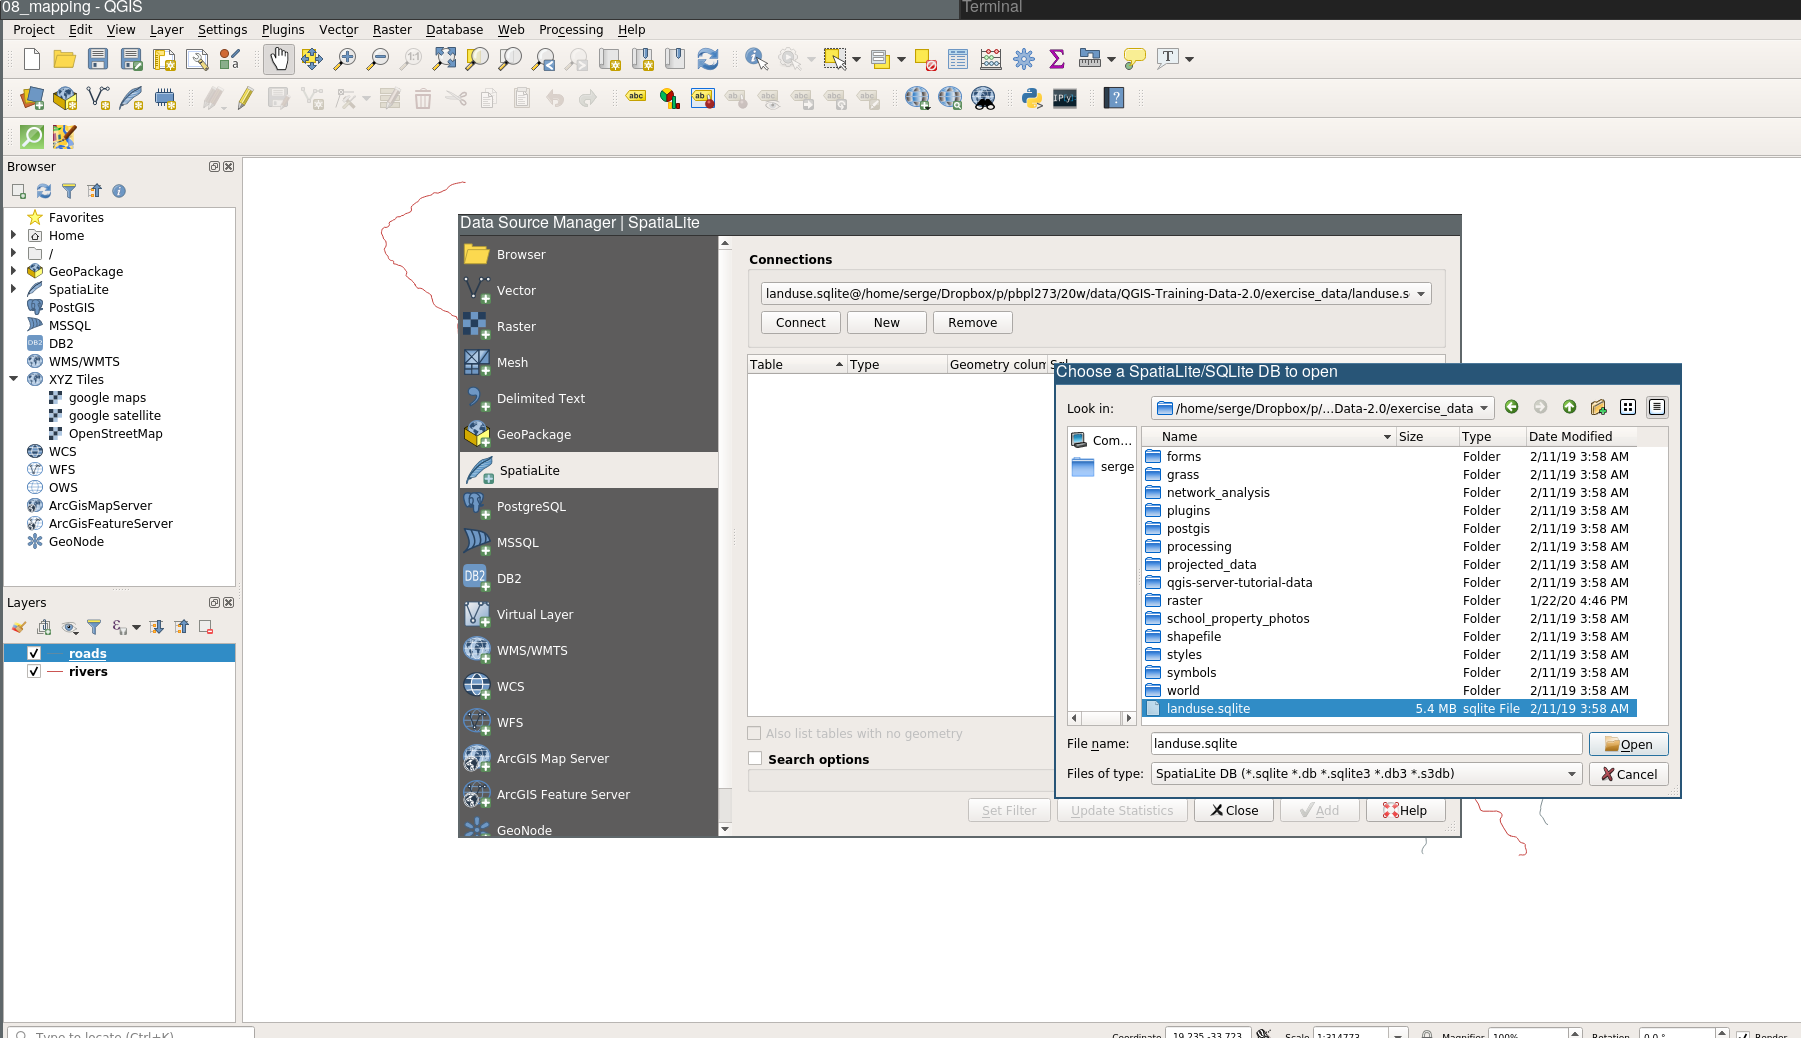
SQLite Connection
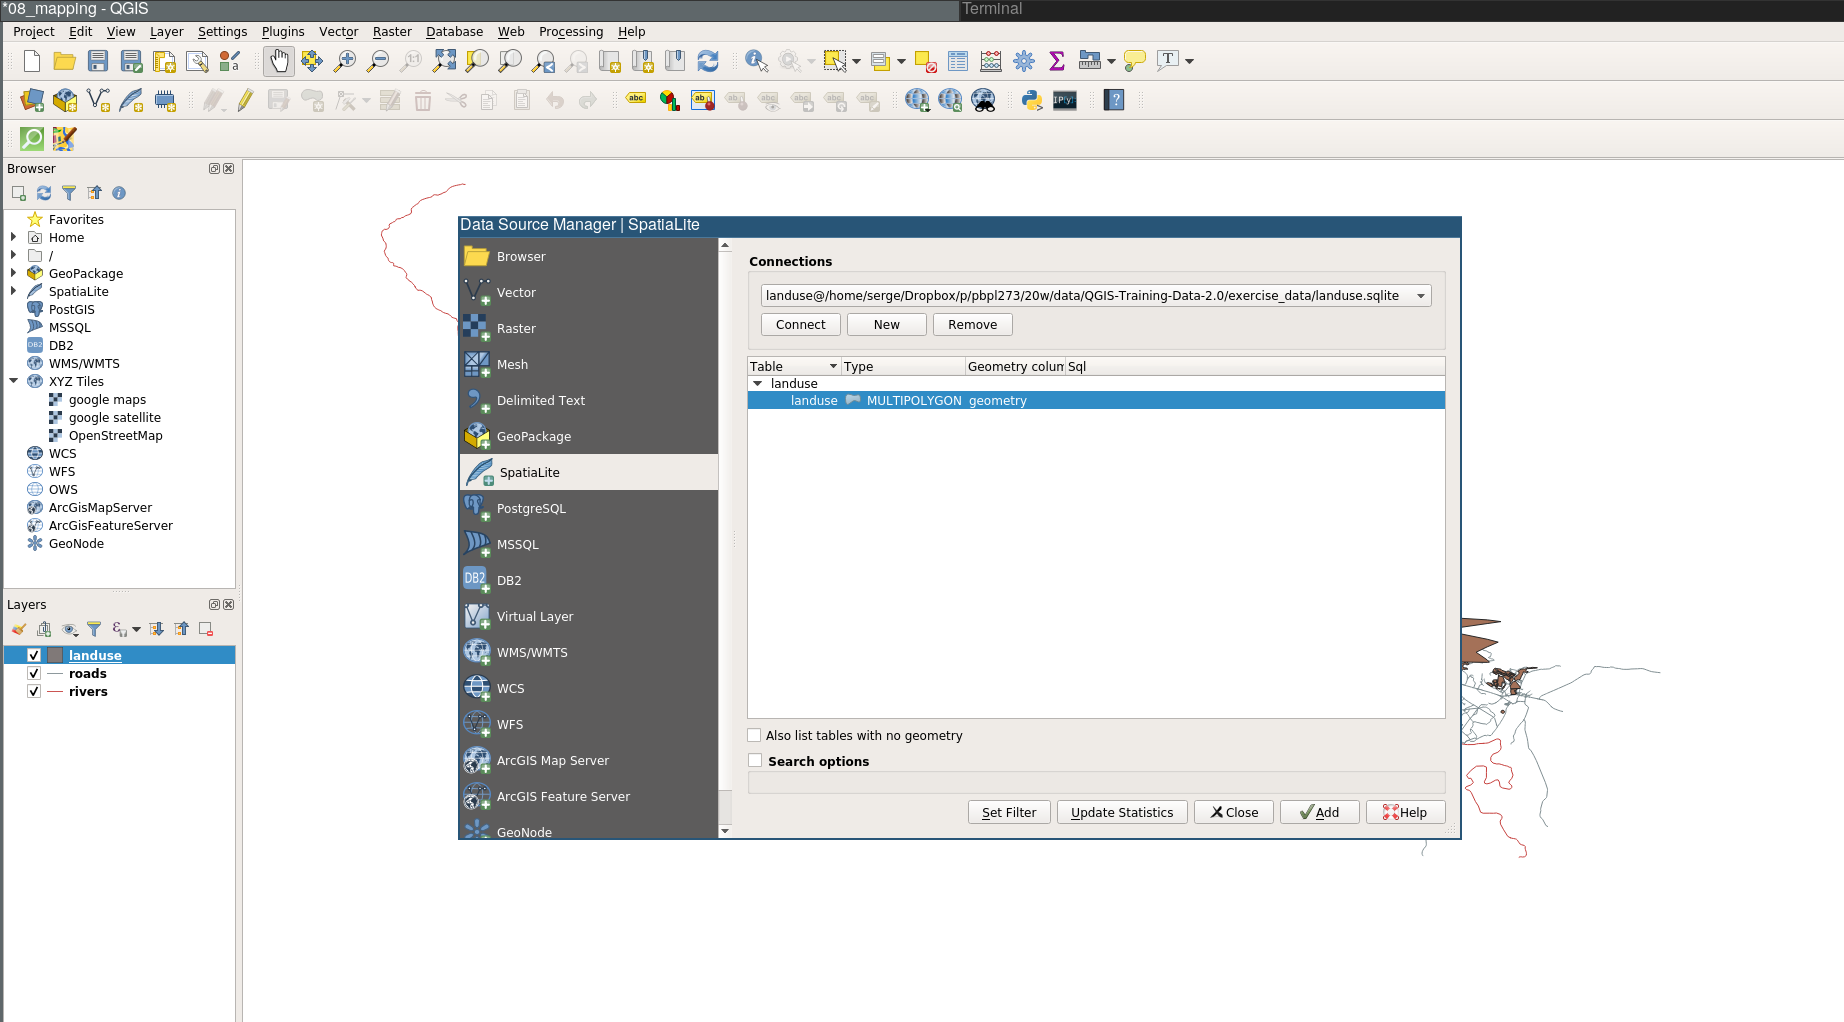
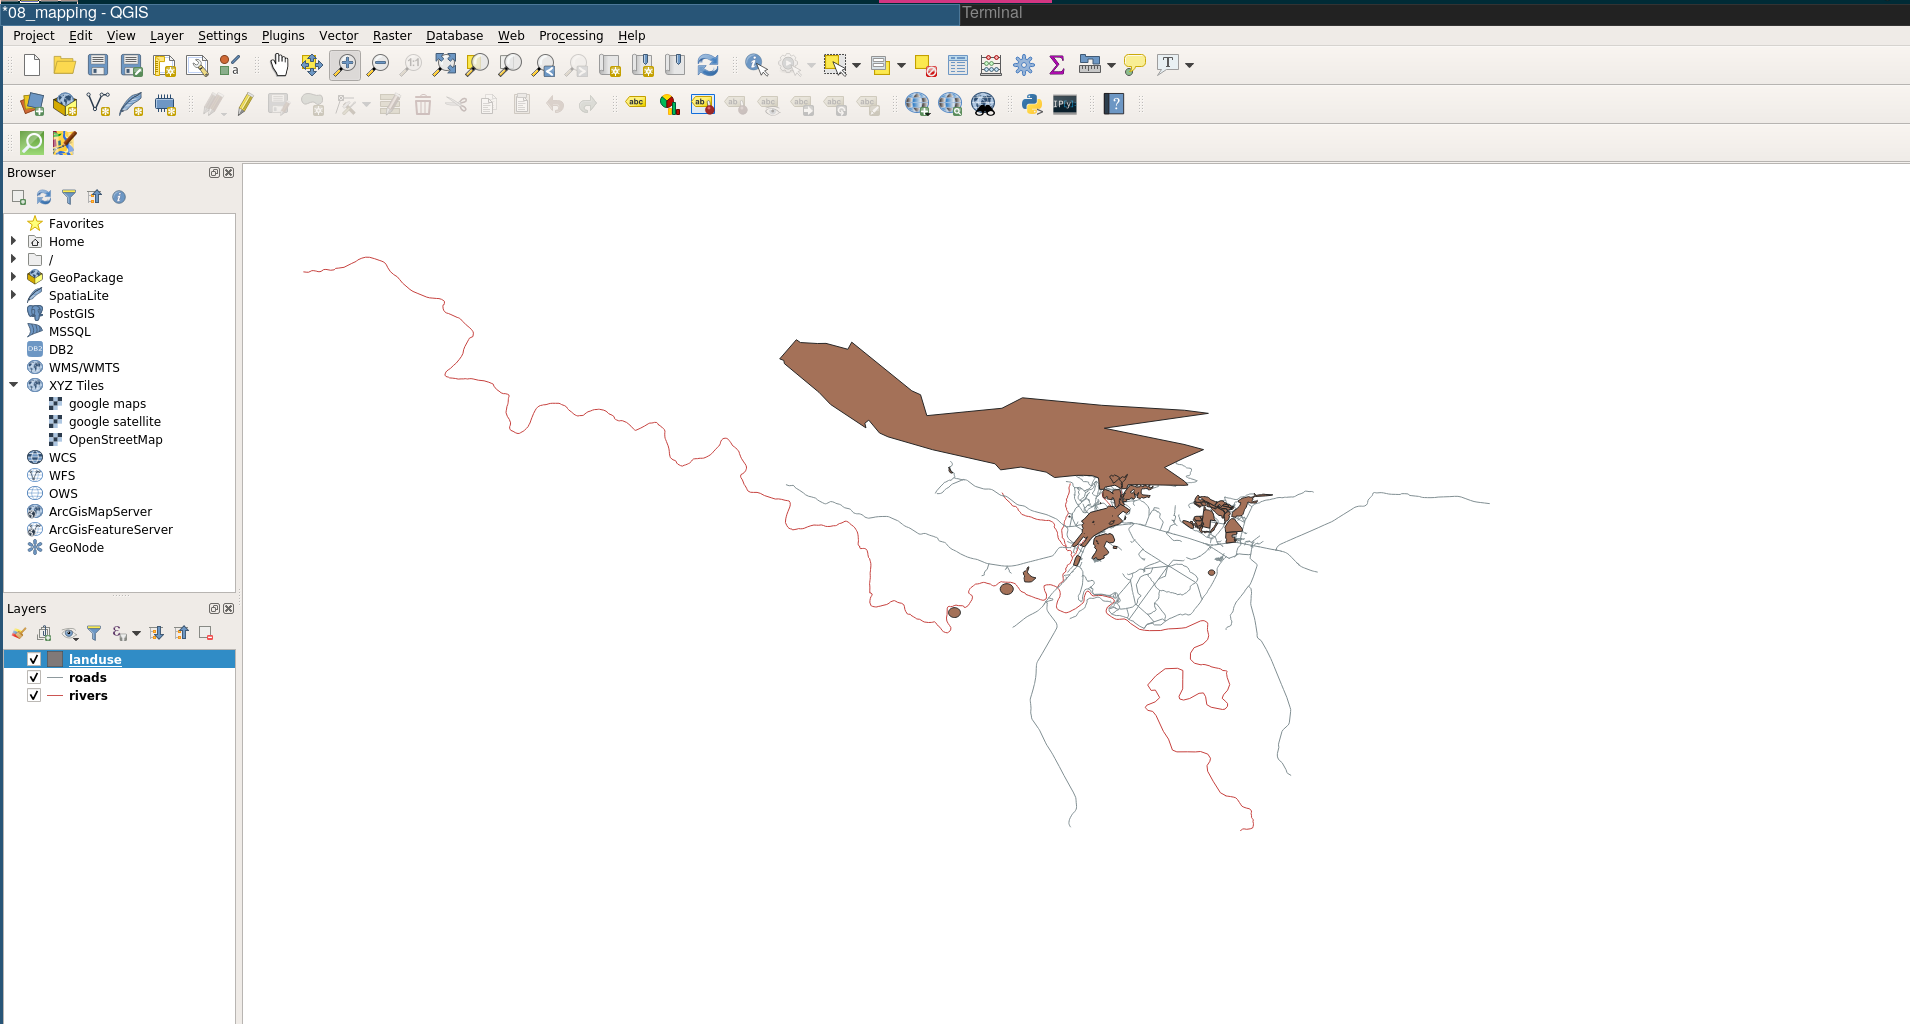
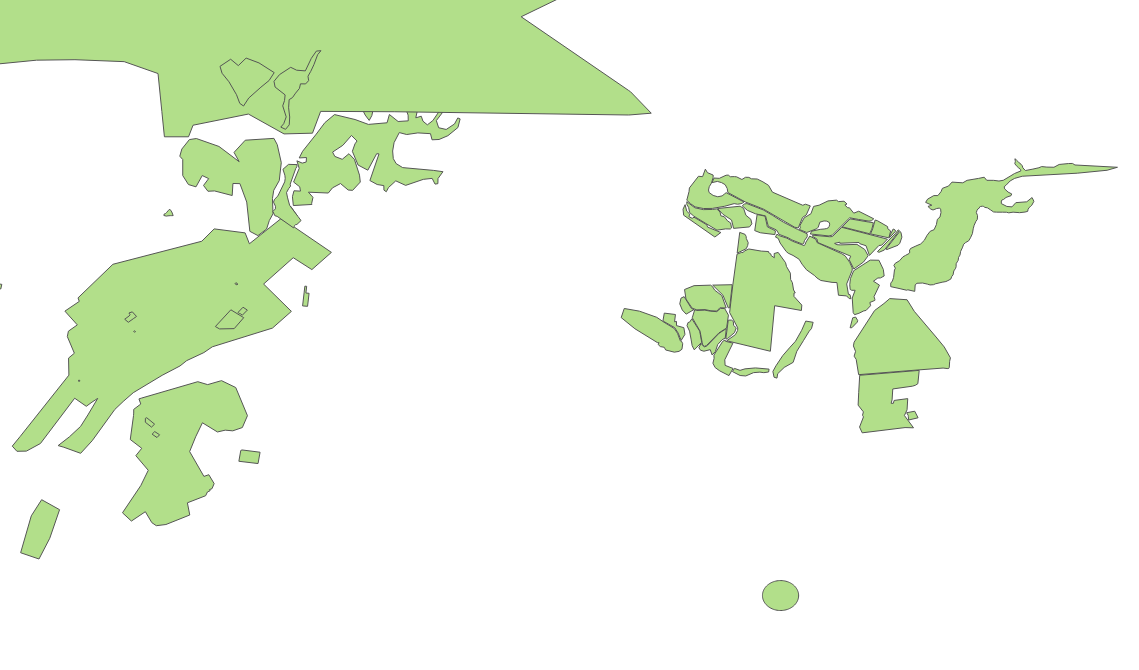
SQLite Land Use
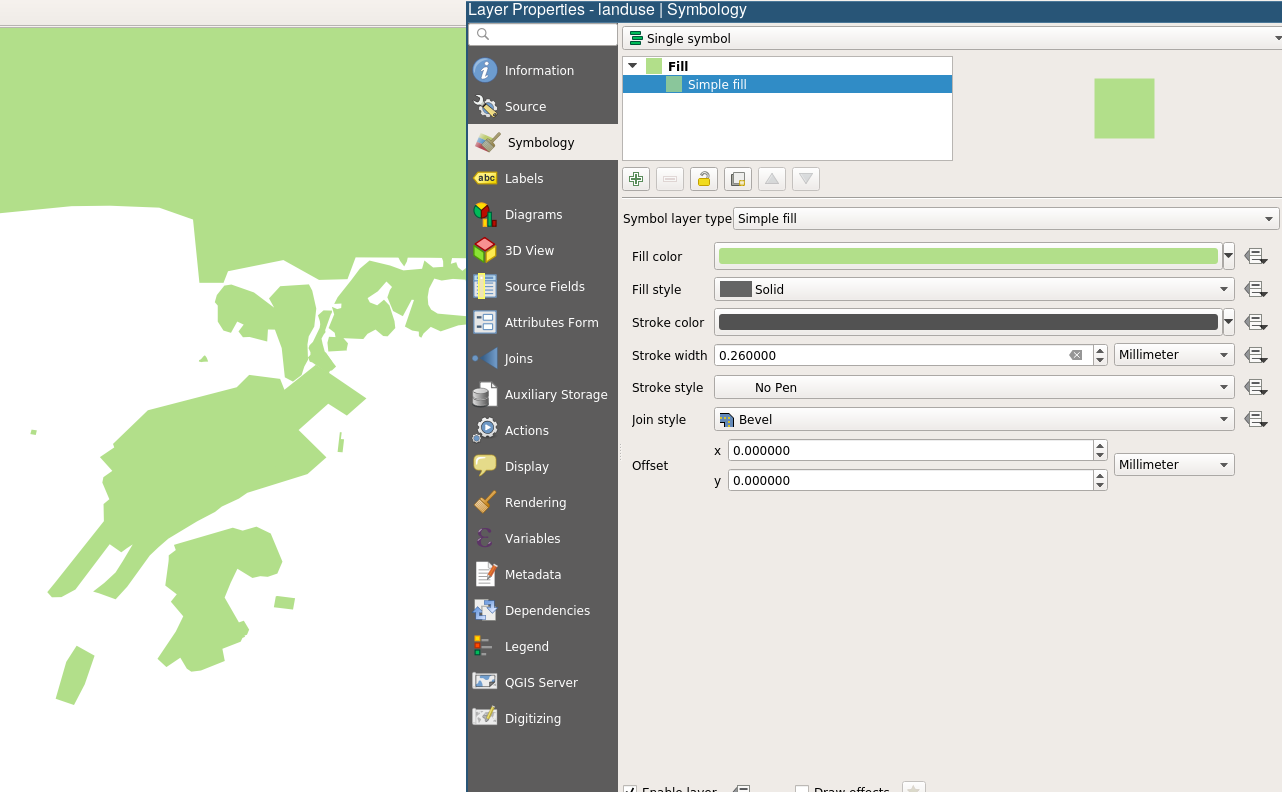
Symbology
Color
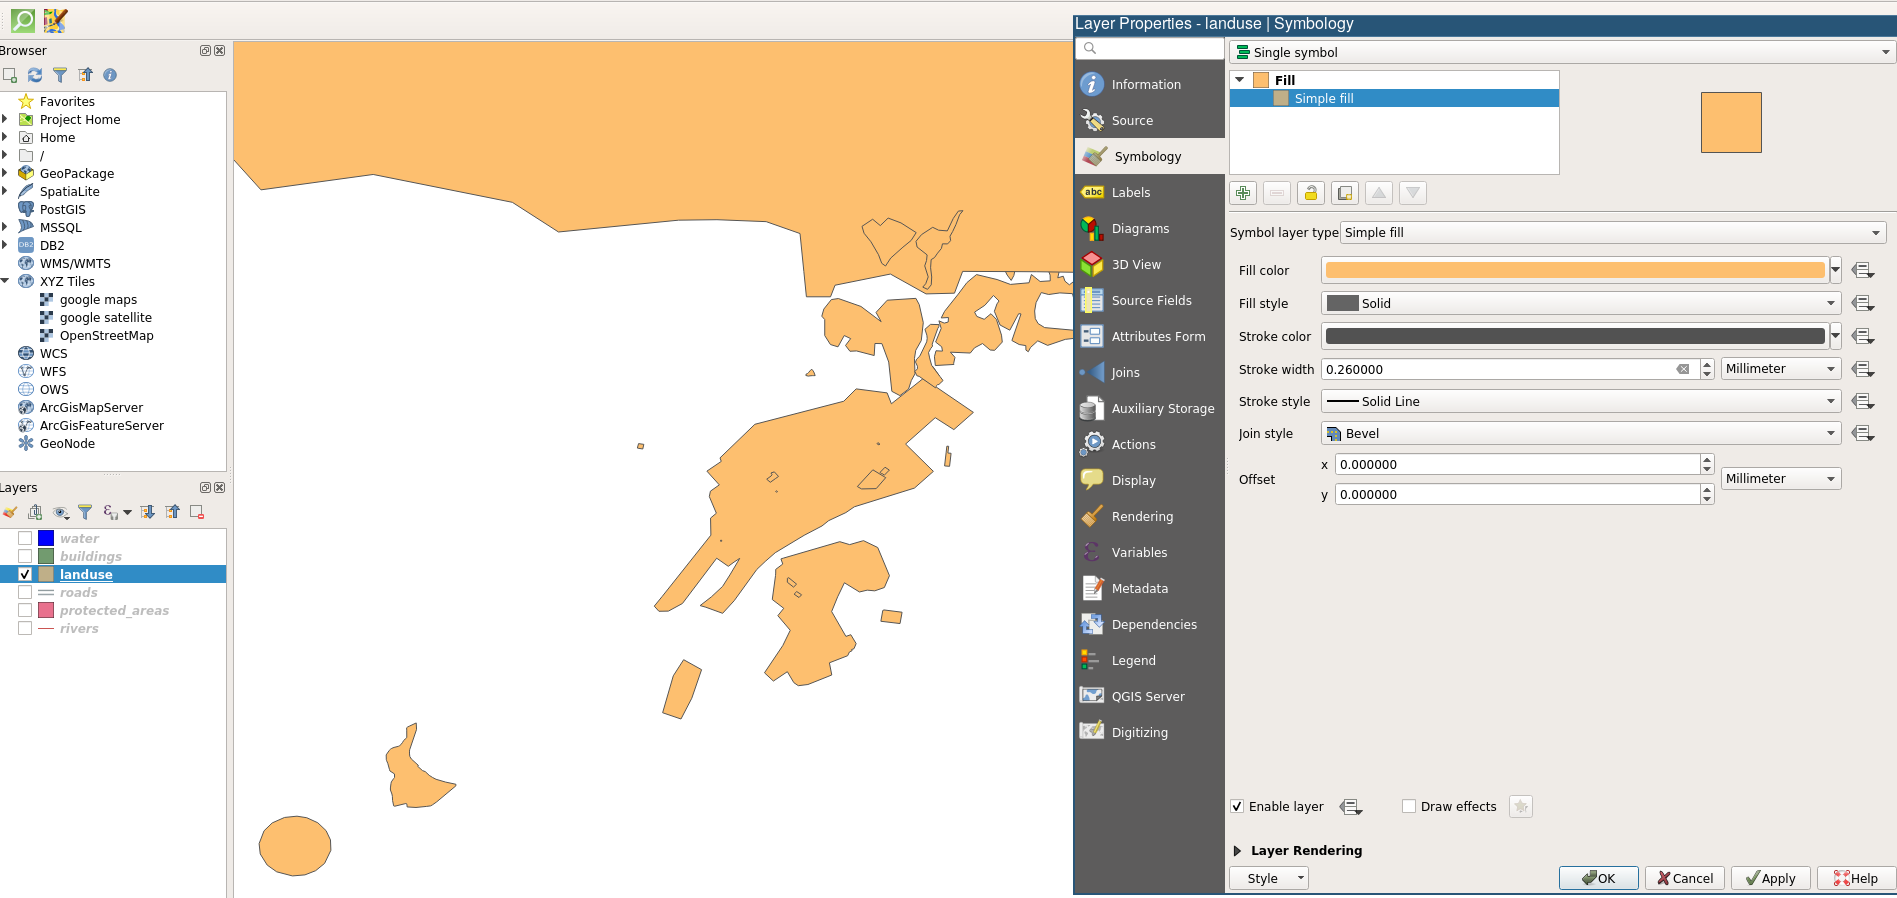
Fill color
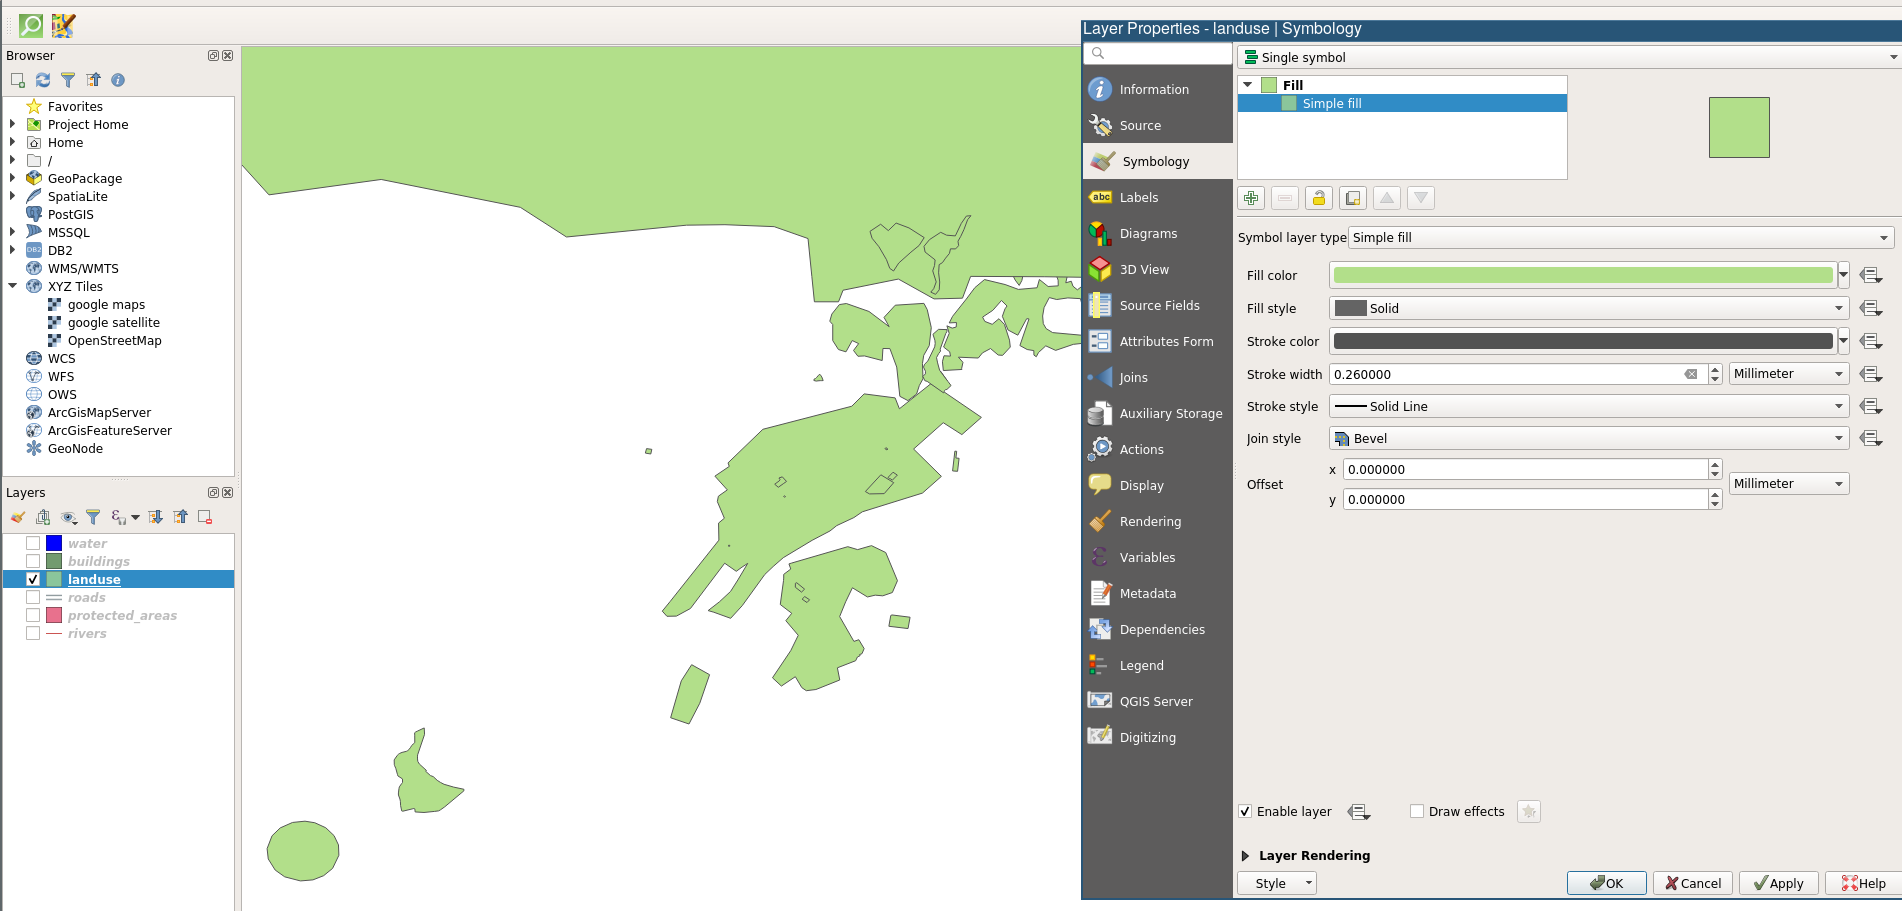
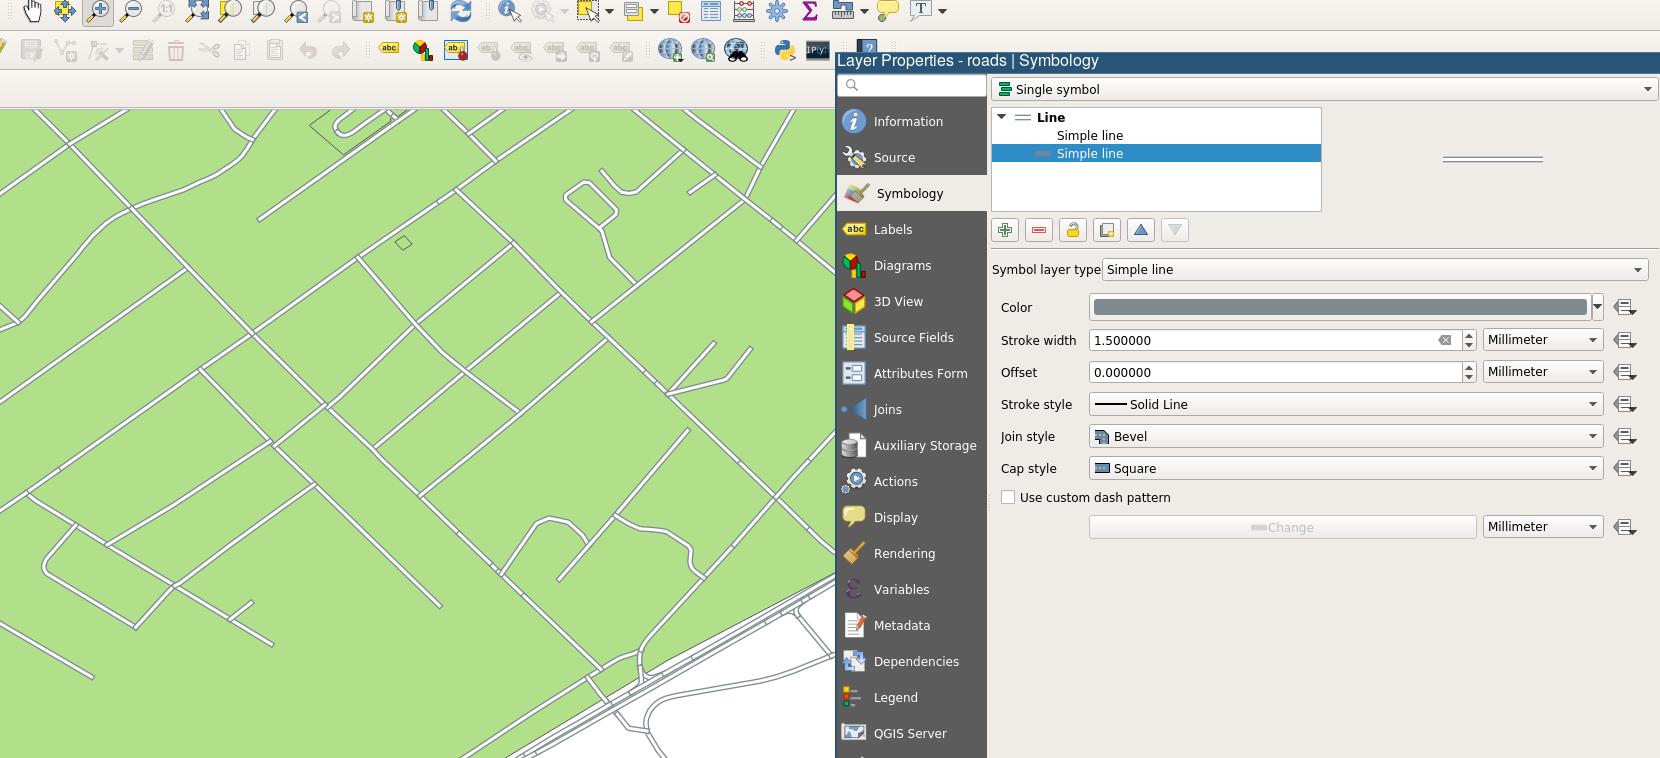
Symbol Structure
Stroke
No pen
Scale-based visibility
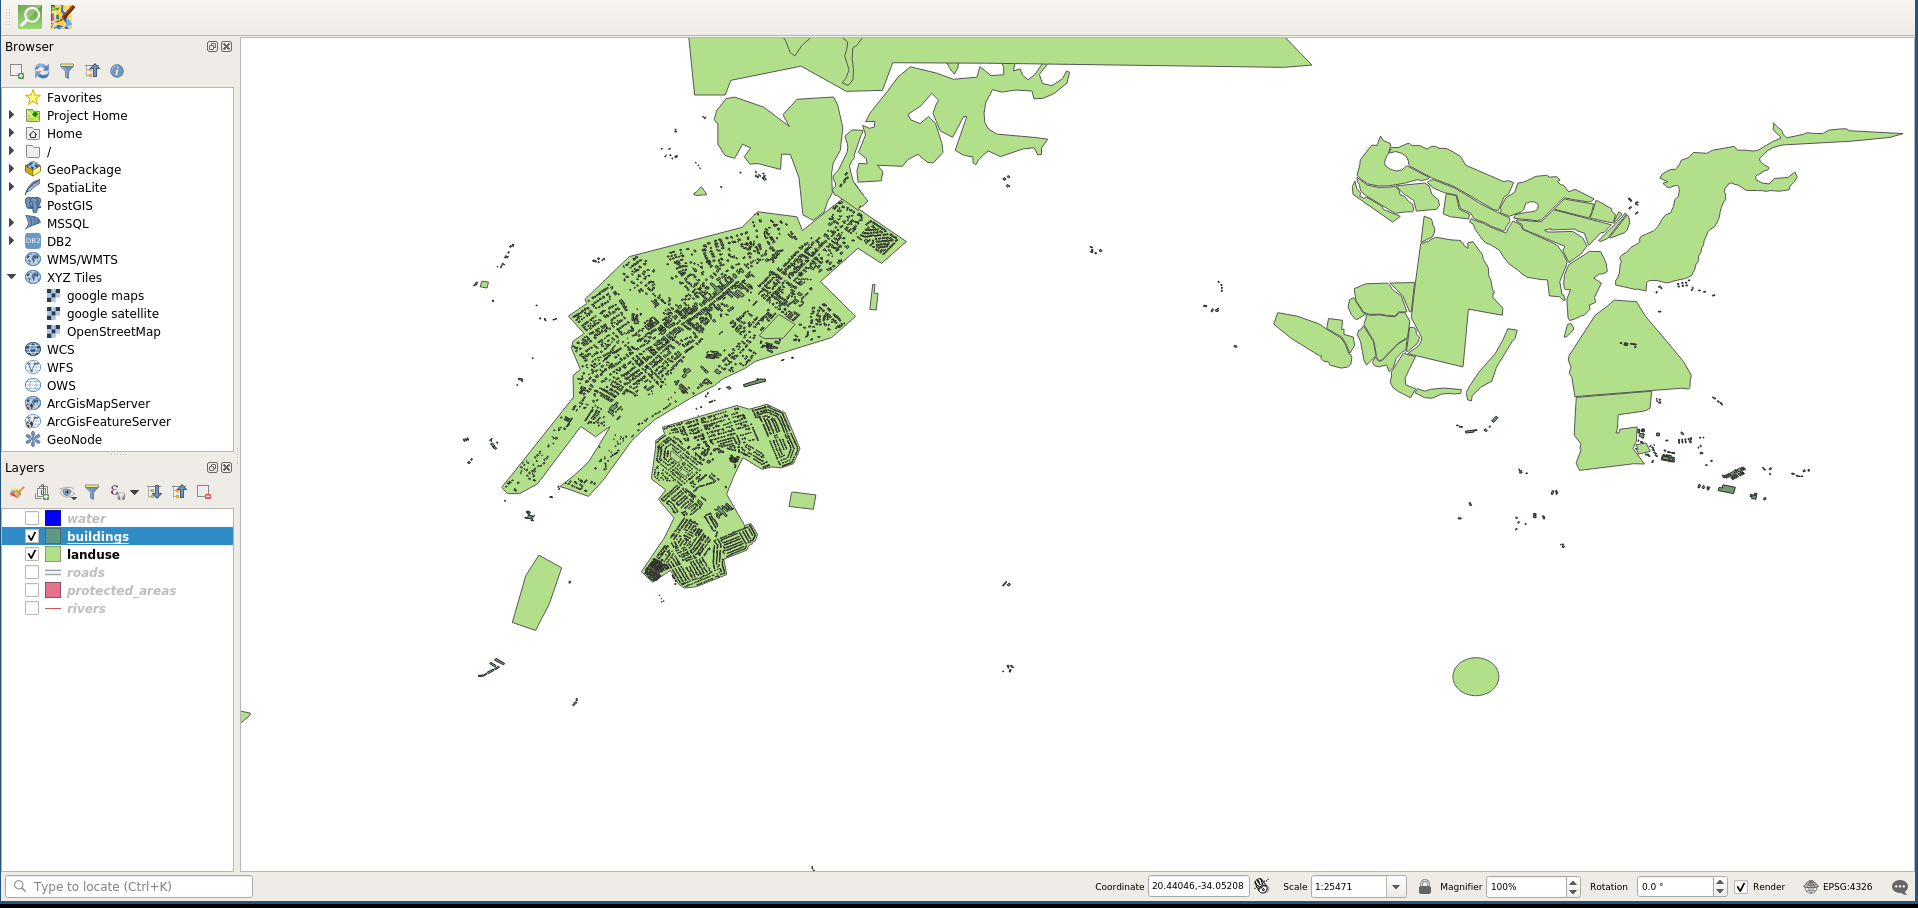
Buildings
Scale-based visibility
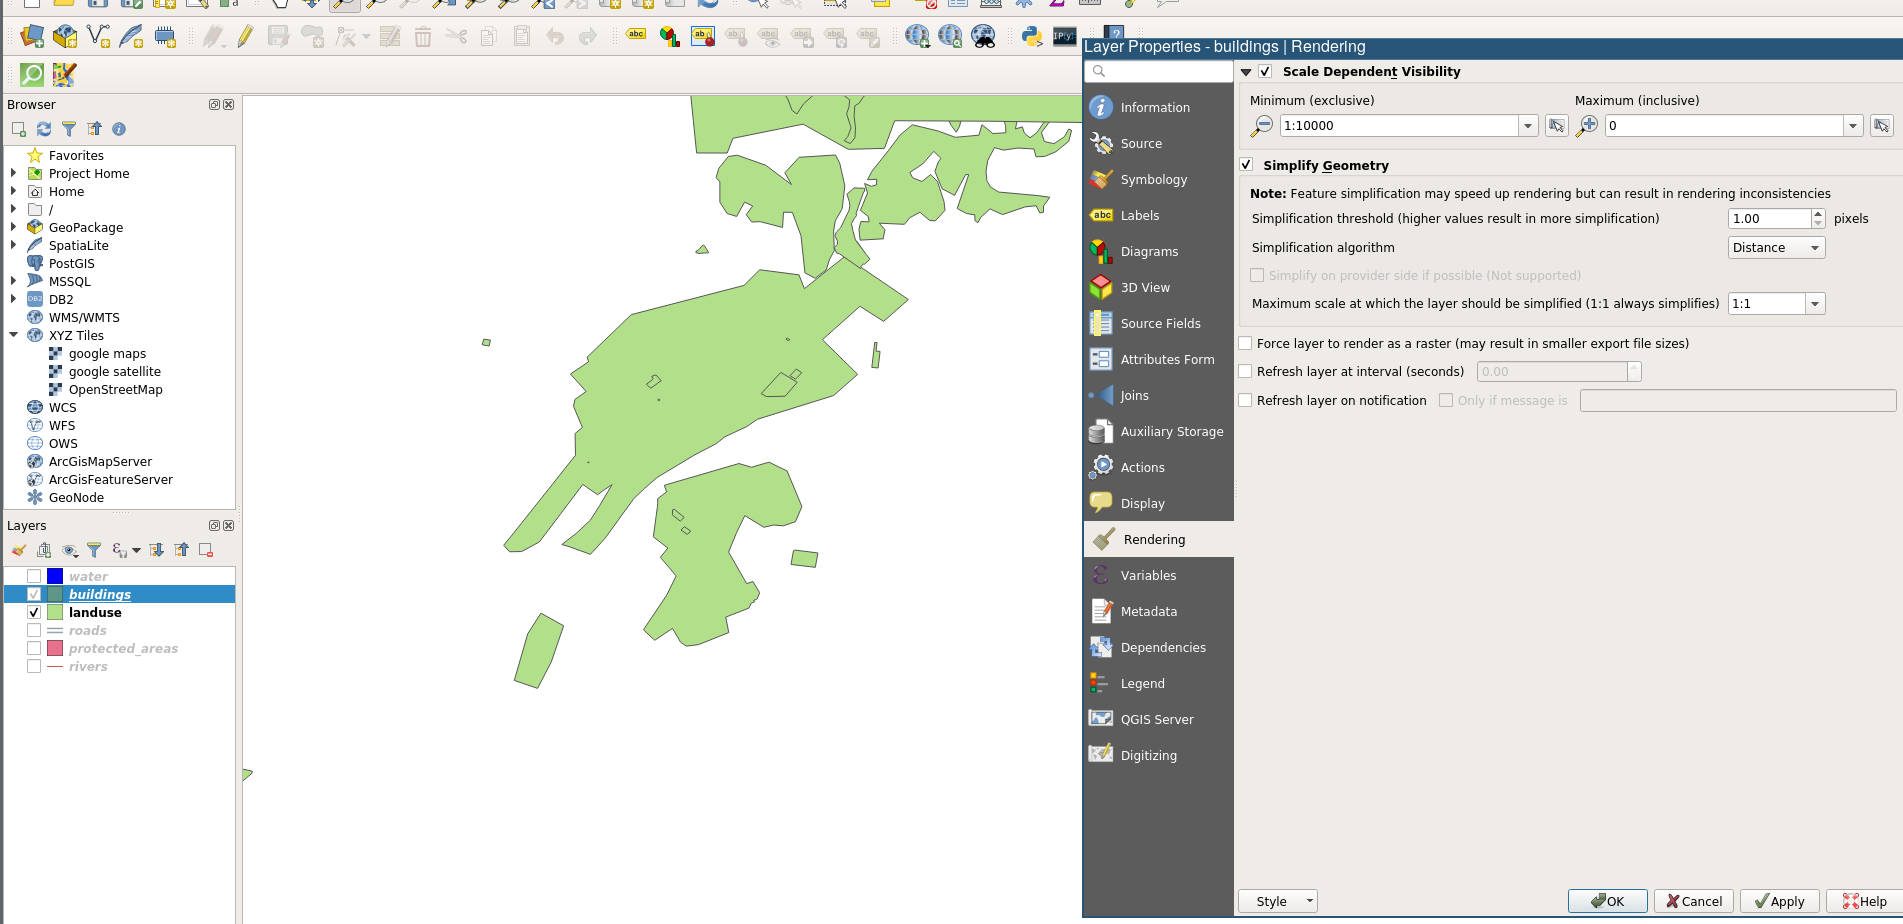
Scale-based visibility
Adding Symbol Layers and Ordering Symbol Levels
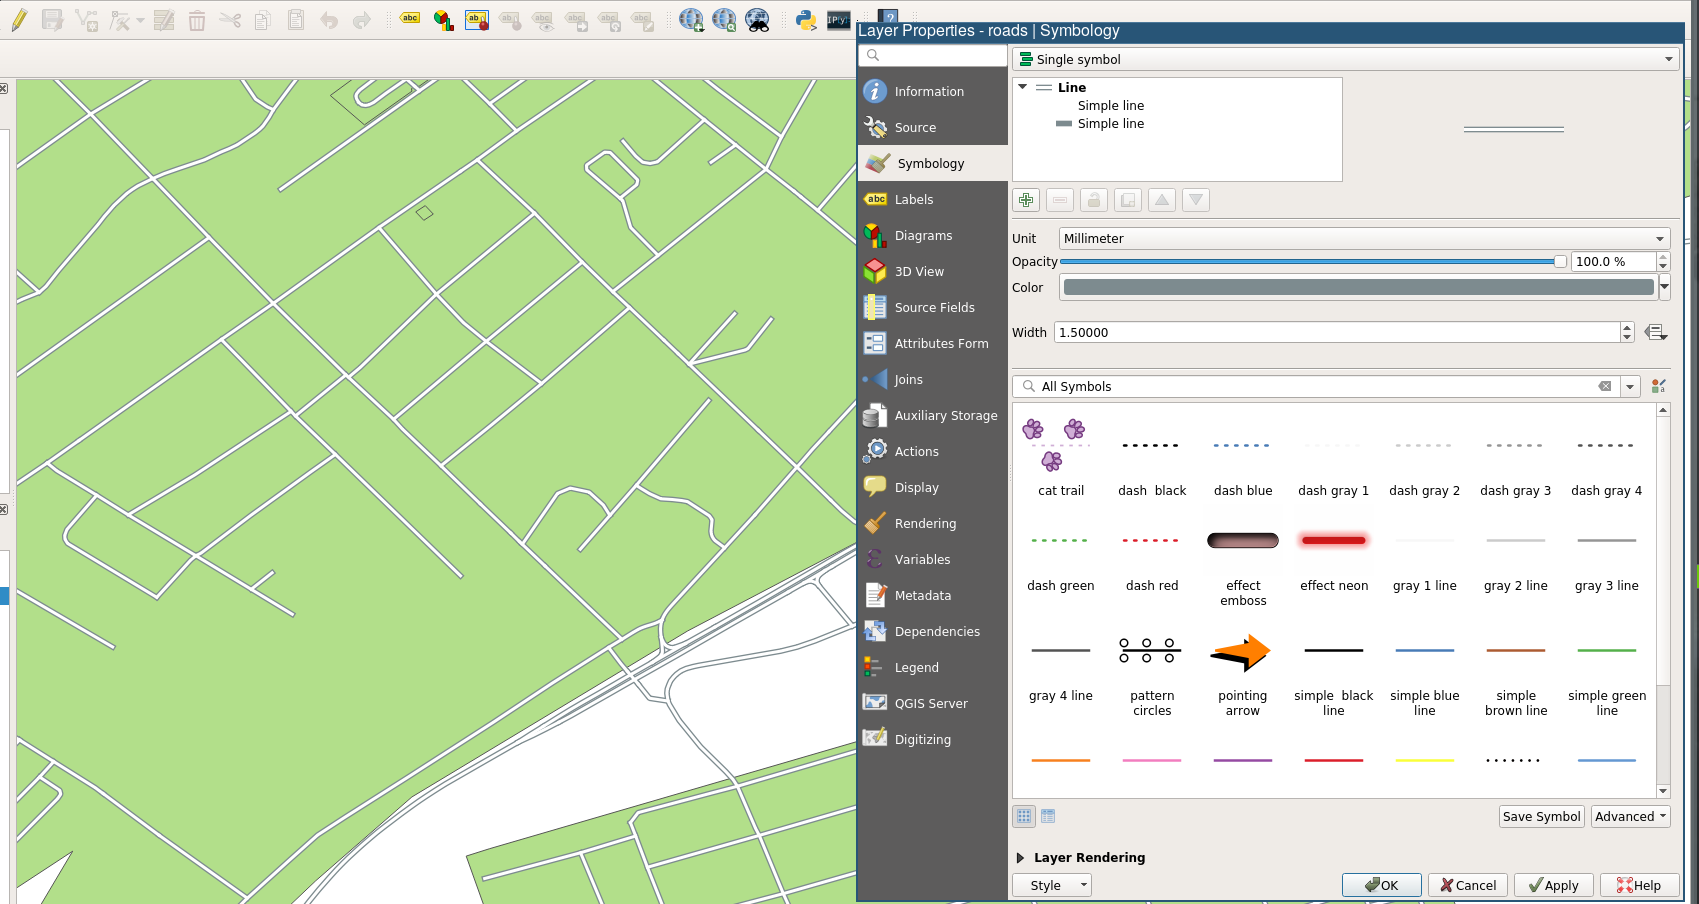
Roads
Add Symbol Layer
Order Symbol Levels
Ordered Symbol Levels
Geometry generator symbology
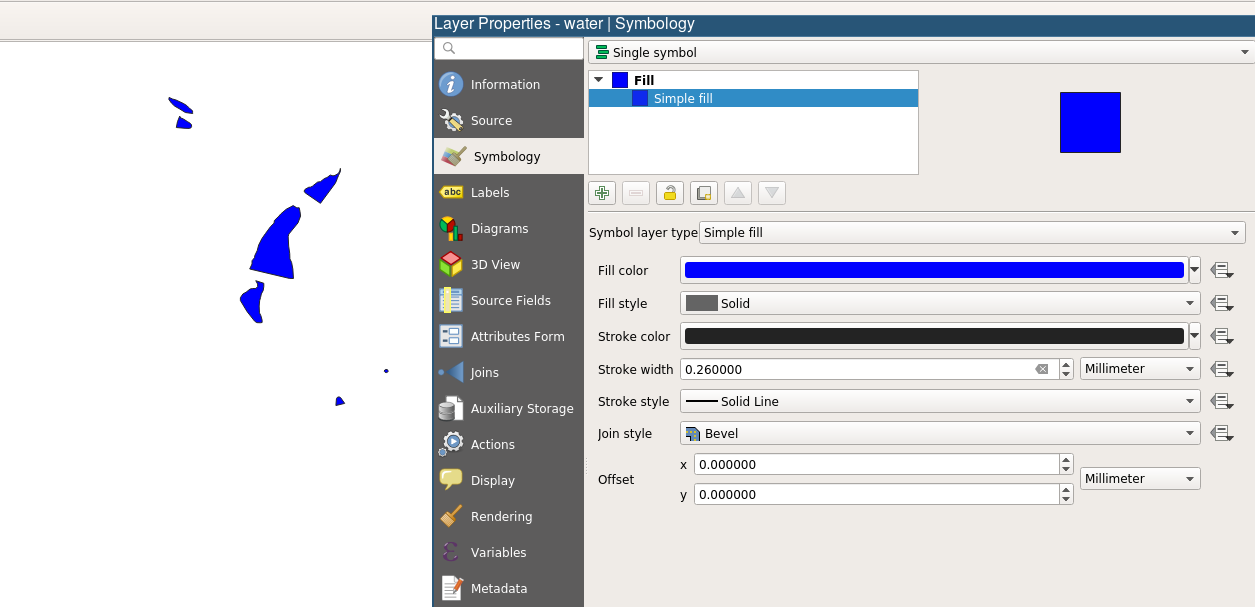
Water: Single Symbol
Water: To Centroid
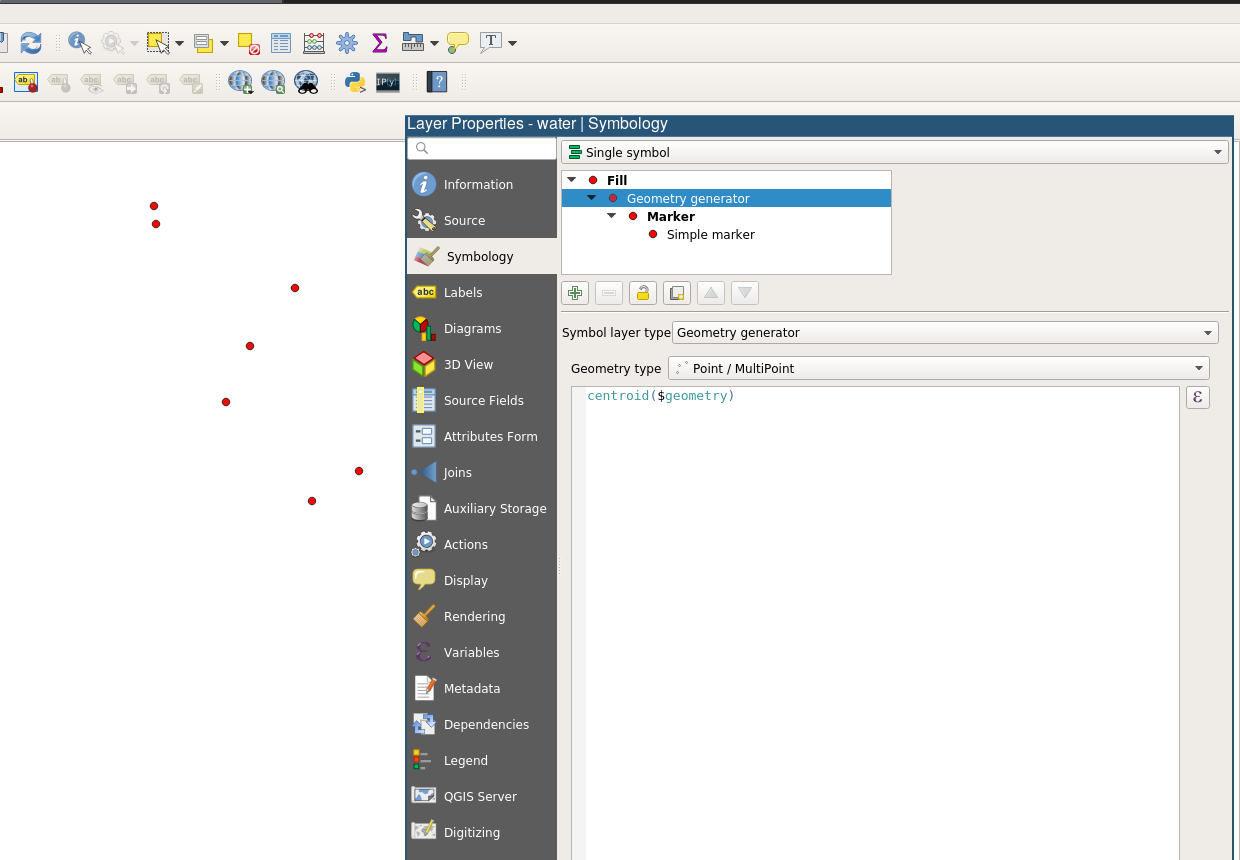
Water: To Centroid
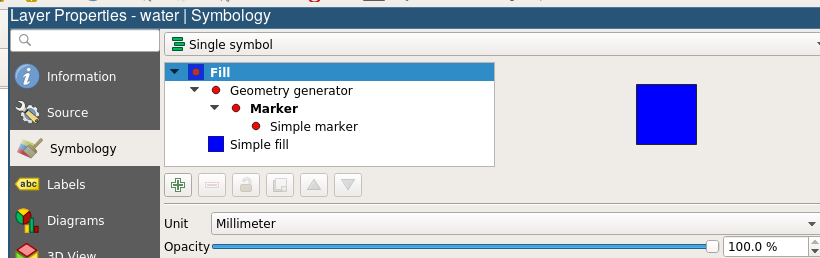
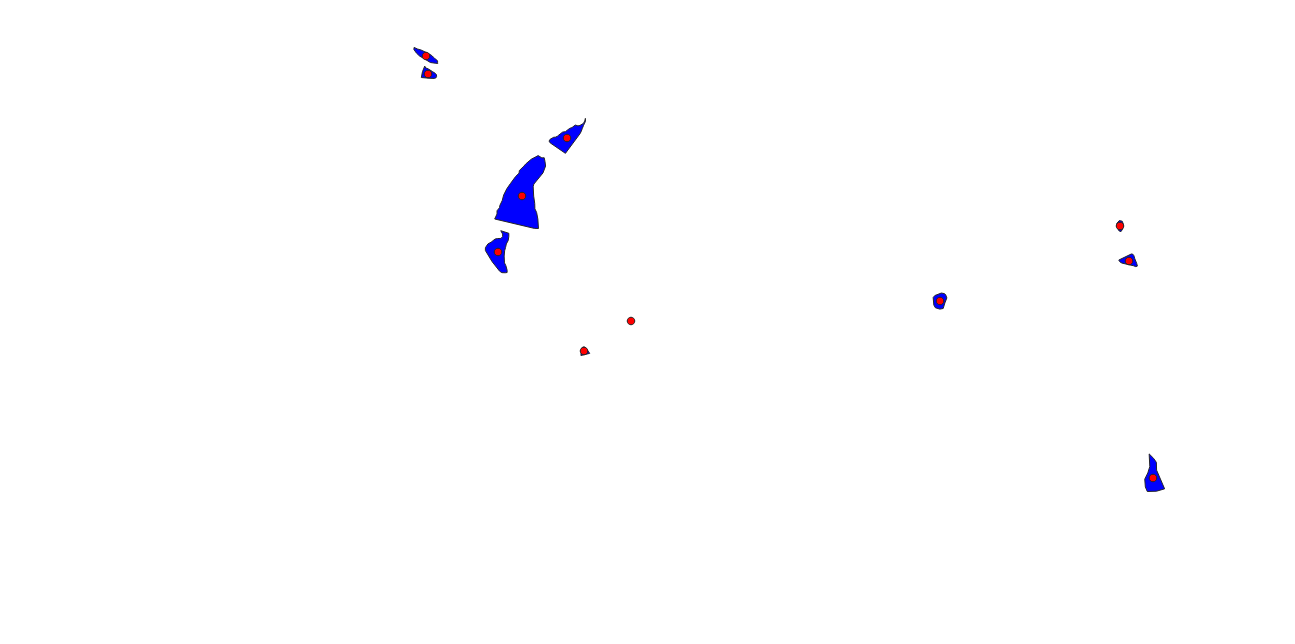
Water: 2 symbol layers
Classifying Vector Data
Why Classification?
- Summarizing the attribute value distribution
- Representing the spatial distribution of attribute values
Measurement Scales
- Nominal: name-based, no order
- Ordinal: arranged in order (ranks)
- Interval: pos, neg, zero values (height above/below sea level)
- Ratio: positive, zero values (distances, degrees Kelvin)
Classifying Nominal Data
SCAG Data: COUNTY
Ratio/Interval Classification
TOTPOP
ACRES
Extensive and Intensive Variables
- AREA and TOTPOP are counts
- Extensive variables
- Geometry size correlated with values
- Choropleths generally not appropriate for extensive variables
Intensive Variables
- Percentages, ratios, densities
- Standardized by area (in some sense)
- Geometry size not correlated with values
- Choropleths appropriate for intensive variables
pctHISP (Equal Interval)
pctHISP (LA Equal Interval)
pctHISP (LA Quantiles: 5)
pctHISP (LA Jenks: 5)
pctHISP (LA Standard Deviation)
pctHISP (LA Pretty Breaks)
mapclassify
Color
ColorBrewer
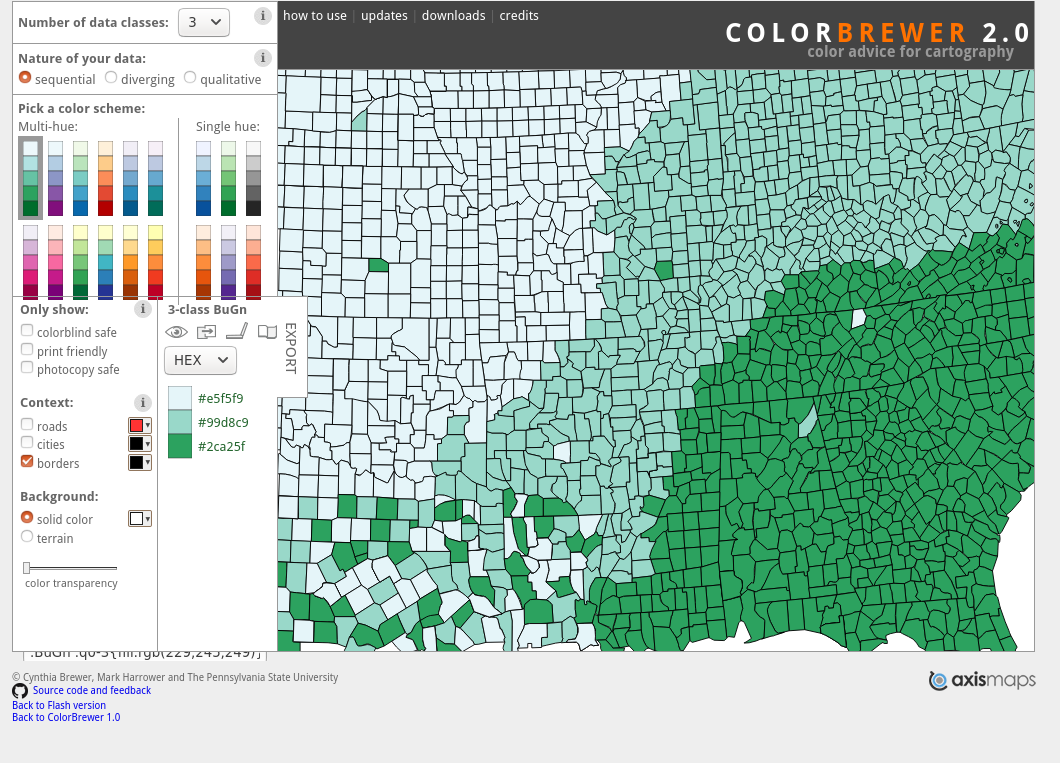
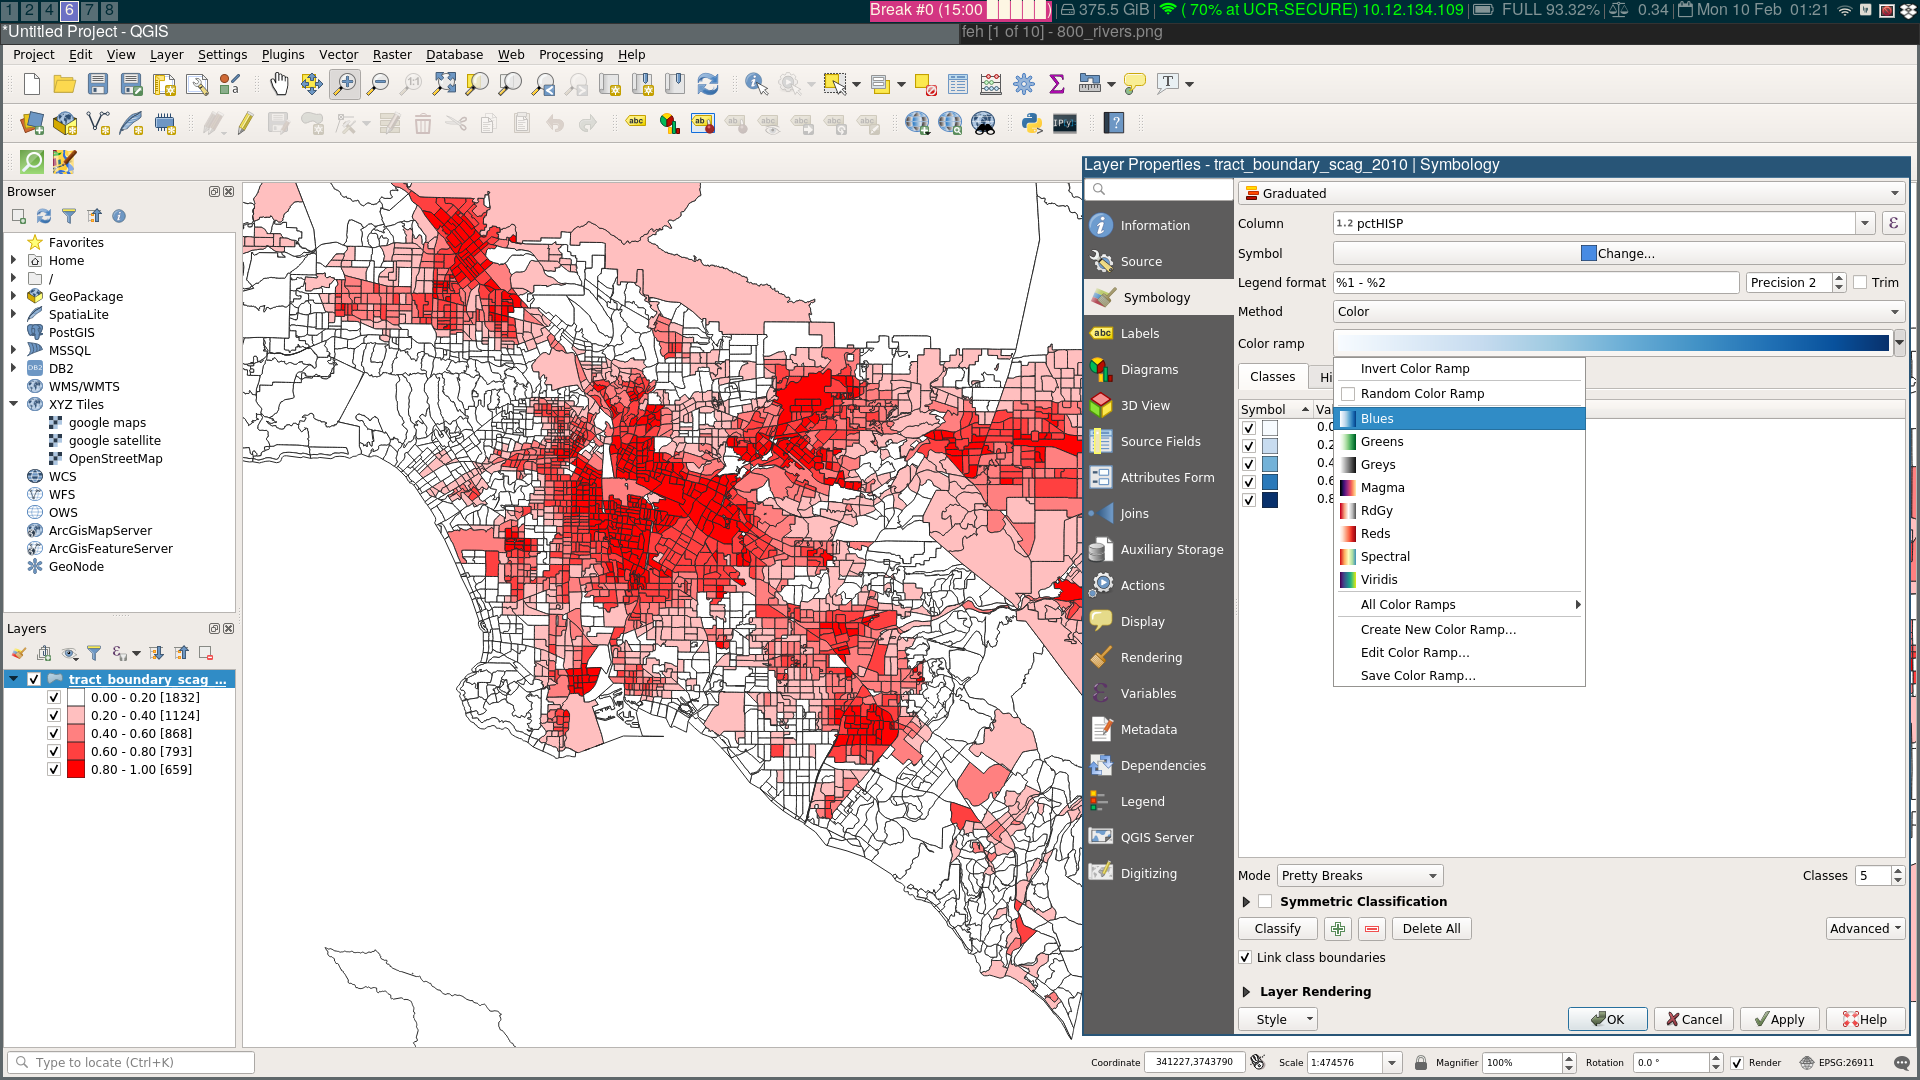
ColorBrewer in QGIS
Next Up
- Creating Vector Data

GIS for Public Policy’20 by Sergio Rey is licensed under a Creative Commons Attribution-ShareAlike 4.0 International License.